
San Mateo County’s median home price jumped 10.6% year over year in July—but larger homes also sold, inventory fell nearly 26%, and buyers paid an average of 106% of asking. We take a closer look at what the numbers really mean.
Continue reading

San Mateo County’s median home price jumped 10.6% year over year in July—but larger homes also sold, inventory fell nearly 26%, and buyers paid an average of 106% of asking. We take a closer look at what the numbers really mean.
Continue reading
Belmont real estate has a surprisingly predictable seasonal rhythm. We looked back through years of local sales data to see when buyer competition typically peaks, when the market cools, and what that means for buyers and sellers.
Continue reading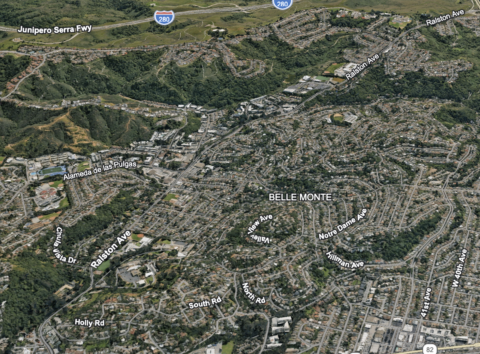
Belmont Housing Market: A Little More Choice — But Still Moving Fast
We’re about two-thirds of the way through the first quarter of 2026, and the early read on the Belmont housing market is coming into focus.
Inventory has opened up modestly. So far this year, 39 homes have come to market, compared with 34 during the same period last year — about a 15% increase. Currently, there are 31 properties in the pipeline, including 19 active listings available to buyers and another 10 “coming soon” homes preparing to enter the market. Eight properties are already pending.
At first glance, the increase in listings appears to be good news for buyers. And to a degree, it is — there are slightly more choices than there were a year ago.
But the market’s pace tells a more important story.
Homes that are going pending are averaging just nine days on the market. That’s a clear signal that new inventory is being absorbed quickly. In fact, the buyers we’ve represented this year have still found themselves in highly competitive situations. On the last two homes we pursued, each drew roughly 15 offers.

That combination — more listings, but very fast absorption — suggests that demand remains strong and pricing pressure is holding firm. If the market were softening, we would expect to see homes sitting on the market longer, more price reductions, and fewer competing offers. So far, none of those conditions are showing up in the data.
It’s still early, and there haven’t been enough closed sales yet to draw firm conclusions about pricing trends for 2026. But the early indicators point to a market that remains still seller-leaning, with motivated buyers acting quickly when well-prepared homes come to market.
The takeaway: Belmont buyers may have a few more options this year — but the window to act is still short, and competition hasn’t gone away.
What this means for you depends on your timing and your strategy.
If you’re thinking about buying or selling in Belmont this year, the early trends suggest preparation and positioning matter more than ever. Sellers need to price and present their homes correctly to capture today’s fast-moving demand, and buyers need a clear plan to compete when the right property appears. If you’d like a quick, no-pressure review of your home’s current value, or a strategy session to understand your options in today’s market, feel free to reach out. We’re always happy to share what we’re seeing locally and help you make informed decisions about your next move.
About the Authors
Drew and Christine Morgan are the founders of MorganHomes, their independent brokerage based in Belmont. They also maintain a strategic affiliation with RE/MAX GOLD, combining the flexibility of an independent firm with the resources of one of the largest real estate networks.
As longtime Belmont residents and real estate professionals with more than 30 years of experience, they have helped generations of local families buy, sell, and make smart real estate decisions. Drew is also a Notary Public, providing additional convenience and support for clients when it matters most.
Their consistent performance has earned them RE/MAX’s prestigious Diamond Award, placing them among the top agents nationwide and among the top performers in Northern California.
If you have questions about the Belmont market or would like to discuss your situation, you can reach them at (650) 508-1441 or info@morganhomes.com.
For ongoing insights about Belmont real estate, local market trends, and community updates, you can subscribe to this blog or follow MorganHomes on Facebook and X.
Disclaimer
This article is provided for educational and informational purposes only. It is not intended as real estate, legal, tax, or insurance advice. Because every situation is unique, we recommend consulting with a qualified professional, like us, to understand your specific circumstances.
MorganHomes
Broker | REALTORS | Notary
DRE#01124318 | 01174047

Belmont is still a seller’s market, but pricing accuracy matters more than it did last year.
Belmont hasn’t softened—it’s just gotten smarter.
San Carlos is one of the strongest-performing markets on the Peninsula right now.
San Carlos is following in Belmont’s footsteps, doing what Belmont did a year ago.
Stabilizing after a blow-off year—still competitive, but more rational.
One of the strongest appreciation stories in 2025.
Sales Activity & Volume
Pricing
The Belmont, San Carlos, and broader San Mateo County markets enter 2026 from a position of strength and stability, not excess. The data from 2024 and 2025 show steady demand, limited inventory, and pricing that continues to be supported by fundamentals rather than speculation.
For sellers, this means the market is still favorable—but no longer forgiving. Homes that are well prepared and accurately priced from the start are likely to attract strong interest. Overpricing, which buyers tolerated in prior years, is increasingly leading to longer market times and missed opportunities. In 2026, strategy and presentation will matter as much as location.
For buyers, conditions are improving modestly. While inventory remains tight, competition has become more measured. Buyers who are well-qualified, decisive, and realistic are finding more opportunities to negotiate—especially on homes that miss the market’s initial pricing window.
Looking ahead, price growth is expected to be moderate rather than explosive, with neighborhood-specific performance playing a larger role than countywide trends. Markets like San Carlos may continue to show momentum, while markets like Belmont are likely to reward consistency and long-term value.
This is shaping up to be a market that favors informed decisions over emotion, rewarding those who understand timing, pricing, and local nuances.
Drew and Christine Morgan are experienced REALTORS and NOTARY PUBLIC located in Belmont, CA, where they own and operate MORGANHOMES, Inc. They have assisted buyers and sellers in their community for over 30 years. Drew and Christine have received the coveted Diamond Award, ranking among the top 50 agents nationwide and the top 3 in Northern California, according to RE/MAX. To contact them, please call (650) 508.1441 or emailinfo@morganhomes.com.
For all you need to know about Belmont, subscribe to this blog right here. You can also follow us on Facebook and on X.
This article provides educational information and is intended for informational purposes only. It should not be considered real estate, tax, insurance, or legal advice; it cannot replace advice tailored to your situation. It’s always best to seek guidance from a professional familiar with your scenario.
BROKER | MANAGER | NOTARY

The truth is, both approaches have their merits…
Continue reading
Here’s a clear breakdown of what’s happening in the San Mateo County (SMC) housing market from 2024 to 2025 based on data from the MLS for Q1.
Key Highlights:
Prices & Valuation:
Volume & Sizes:
Market Dynamics:
Summary Insight:
The SMC housing market in 2025 looks like it’s in a hot but slightly more balanced phase:
Commentary: With all the uncertainty around tariffs, buyers are taking the classic “wait-and-see” approach — emphasis on the wait. One thing they’re sure of? Their stock portfolios took a hit… but hey, it’s only a loss if they cash out to buy that house, right? Yet another reason to stay on the sidelines a little longer and let the dust (and the Dow) settle.

The Risk Reward? Buy now while prices are climbing a little and bidding wars are catching their breath — or wait with the crowd for “more certain times” and join the stampede when the bidding starts up full throttle again.
Drew and Christine Morgan are experienced REALTORS and NOTARY PUBLIC located in Belmont, CA, where they own and operate MORGANHOMES, Inc. They have assisted buyers and sellers in their community for over 30 years. Drew and Christine have received the coveted Diamond award and ranked among the top 50 agents nationwide and the top 3 in Northern California by RE/MAX. To contact them, please call (650) 508.1441 or emailinfo@morganhomes.com.
For all you need to know about Belmont, subscribe to this blog right here. You can also follow us on Facebook and on Twitter.
This article provides educational information and is intended for informational purposes only. It should not be considered real estate, tax, insurance, or legal advice; it cannot replace advice tailored to your situation. It’s always best to seek guidance from a professional familiar with your scenario.
BROKER | MANAGER | NOTARY

The election year introduced a temporary pause in the ongoing rebound of home sales and prices.
Continue reading
San Mateo County Housing Market Snapshot: A Mixed Bag of Growth and Decline
The Q3 2024 housing market in San Mateo County reveals notable shifts compared to the same quarter in 2023. While total sales volume and median sale prices increased, other key indicators suggest tightening market dynamics.
Sales Surge Amid Reduced Inventory: The number of homes sold increased by 7.7%, rising from 902 to 977, likely due to strong demand despite the dropping number of new listings. This is reflected in the lower inventory levels—the inventory of homes that haven’t sold by the end of a month.

Pricing Trends Show Hidden Results:
Median sale prices grew by 4.5%, reaching $1,908,700. At the same time, the cost per square foot climbed 5.2% to $1,149.
In Q3 2024, lot sizes shrank 24.7% (15,606 to 12,514 sq. ft.), and home sizes dropped 4.7% (to 2,012 sq. ft.). These shifts skew the reported appreciation, as smaller homes on smaller lots sold for 5.2% more. Adjusting for size differences and price per square foot ($60.00), the true median price appreciation is closer to 15.1% year-over-year.
Price Per Square Foot Climbs Nearly 9% The average price per square foot rose sharply, jumping 8.8% from $865 to $949. This uptick underscores rising property values and increased buyer competition. Higher demand, coupled with limited supply, is driving prices higher on a per-square-foot basis, a clear sign of a strengthening market. If inventory constraints remain, expect this trend to persist.
Faster Sales, Fewer Days on Market: Homes sold quicker in 2024, with the average days on market (DOM) dropping from 24 to 23 days, a minuscule 4.3% improvement. This indicates continued competition for available homes.
Strong Pricing Power: Sellers continued to receive more than asking prices, with the percentage of list price received improving to 105%, up 1%.
Total Sales Volume Climbs: The market saw a 5.9% increase in sales volume, reaching $2.35 billion, signaling robust overall growth.
Tighter Months of Inventory: The months of inventory dropped to 1.6, reflecting a 12.5% tightening, signaling a shift toward a stronger seller’s market.
In summary, Q3 2024 shows an increasingly competitive market with rising demand and constrained supply. While buyers face higher prices and smaller lots, sellers benefit from faster sales and strong pricing power. If inventory remains low, expect continued price pressures.
Drew and Christine Morgan are experienced REALTORS and NOTARY PUBLIC located in Belmont, CA, where they own and operate MORGANHOMES, Inc. They have assisted buyers and sellers in their community for over 30 years. Drew and Christine have received the coveted Diamond award and ranked among the top 50 agents nationwide and the top 3 in Northern California by RE/MAX. To contact them, please call (650) 508.1441 or email info@morganhomes.com.
For all you need to know about Belmont, subscribe to this blog right here. You can also follow us on Facebook and on Twitter.
This article provides educational information and is intended for informational purposes only. It should not be considered real estate, tax, insurance, or legal advice, and it cannot replace advice tailored to your specific situation. It’s always best to seek guidance from a professional who is familiar with your scenario.
BROKER | OWNER | NOTARY

“We’re seeing the strongest market conditions since the beginning of 2022…”
Continue reading
Our market peaked in May of 2022, began a slow slide until it hit bottom of that year in November, before regaining its traction and the slow pace of recovery.
Continue reading