How much money do you really need to buy a home in Belmont? Using the current median home price of $2.2 million, we break down common down payment options, closing costs, and total cash needed so buyers can plan with confidence.
Continue reading

How much money do you really need to buy a home in Belmont? Using the current median home price of $2.2 million, we break down common down payment options, closing costs, and total cash needed so buyers can plan with confidence.
Continue reading
Have you ever driven through Belmont and wondered who the people behind the street names were?
Not just wondered briefly, but really wondered.
Who was Lyon? Why is there a Monroe Drive? Was Alameda de las Pulgas always called that? And what is the story behind that curious little round turret building that still stands along the roadway like something left behind from another century?
The answers are hiding in plain sight.
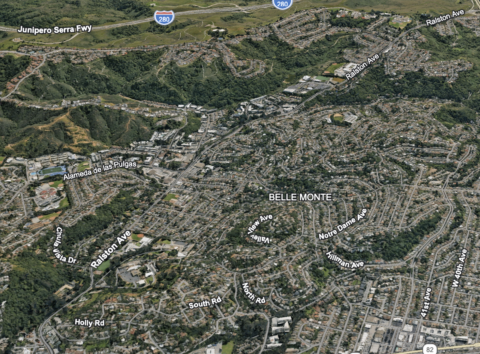
Every day, thousands of Belmont residents travel roads named after men they have never met, pass buildings whose original purpose has long been forgotten, and live atop land that once held dreams grand enough to rival the Peninsula’s most exclusive communities.
To uncover the mystery, we need to travel back a century.
A Grand Vision in the Wooded Hills
The year was 1925.
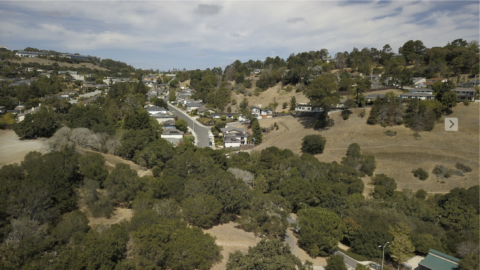
Belmont was still largely undeveloped, a collection of wooded hillsides and open land nestled between San Francisco and San Jose. Yet three men saw something more.
Arthur Lyon.
Lee Monroe.
Lawrence Miller.
Together they formed Belmont Country Club Properties and set out to create what they hoped would become one of the Peninsula’s most prestigious residential communities.
If those names sound familiar, they should.
Their names still appear on Belmont street signs today.
In fact, Mr. Lyon seems to have enjoyed a certain advantage in the naming process. Belmont eventually honored him twice, with both Lyon Avenue and Arthur Avenue preserving his place in local history.
Their plan was ambitious.
Perhaps even audacious.Imagine an elegant country club overlooking the hills, surrounded by an 18-hole golf course called Hillcrest. There would be tennis courts, handball courts, a swimming pool, a children’s wading pool, and beautifully designed homes arranged around manicured fairways.
The centerpiece would be a magnificent clubhouse named Belle Monte.
The price tag?
A staggering $65,000 in 1925.
The Round Tower Mystery
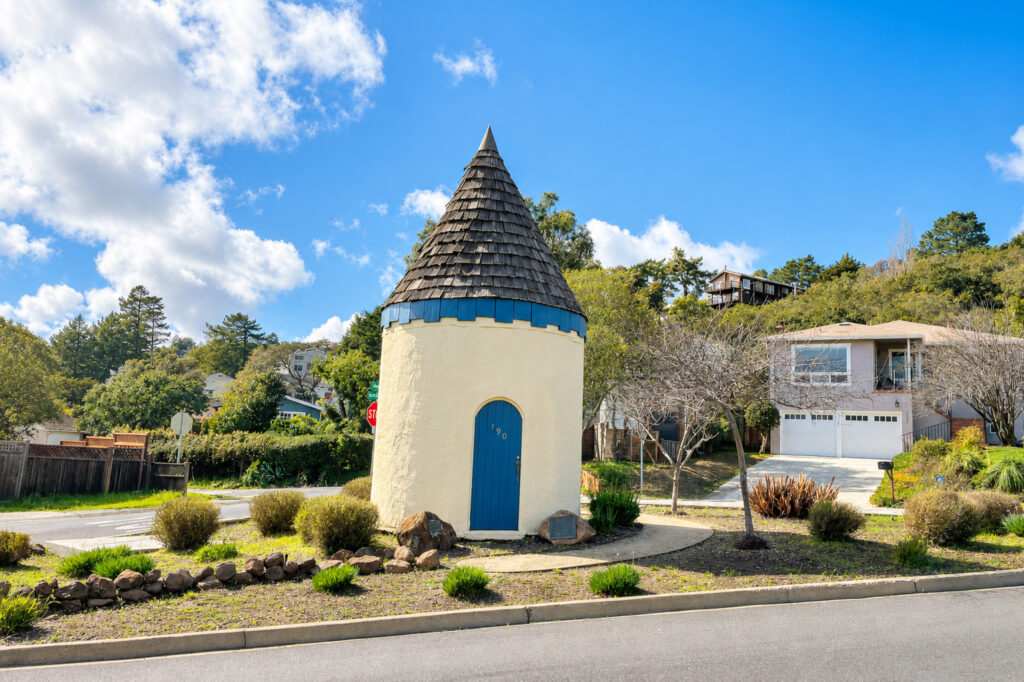
Across from the clubhouse stood an unusual little building.
Round.
Compact.
Almost whimsical.
Many Belmont residents have noticed it while driving along Alameda de las Pulgas.
Most assume it was somebody’s odd residence.
It wasn’t.
The tiny structure served as the sales office for the development.
This was where prospective buyers came to imagine their future lives among Belmont’s rolling fairways and elegant homes.
The building still survives today, quietly guarding its century-old secret while traffic rushes past.
Free Beer and Real Estate
Selling homes in the 1920s required creativity.
Or perhaps persuasion.
Belmont Country Club Properties offered free transportation from San Francisco to Belmont.
Prospective buyers would board buses, enjoy refreshments—including beer—and tour the property while salesmen painted pictures of country club living and leisurely afternoons on the golf course.
Purchase a lot and the membership in the country club was included.
For $100, residents gained access to what promised to become one of the most desirable recreational destinations on the Peninsula.
It was a marketing strategy that would probably attract attention from modern regulators.
But in the Roaring Twenties, it worked.
For a while.
The Dream Unravels
Then came 1929.
The stock market crashed.
The economy collapsed.
And Belmont’s grand experiment suddenly found itself fighting for survival.
Memberships dwindled.
Families moved away.
The developers attempted to keep the club alive by opening it to the public, but the economic forces sweeping across America proved too powerful.
The corporation eventually went bankrupt.
The dream was over.
Or so it seemed.
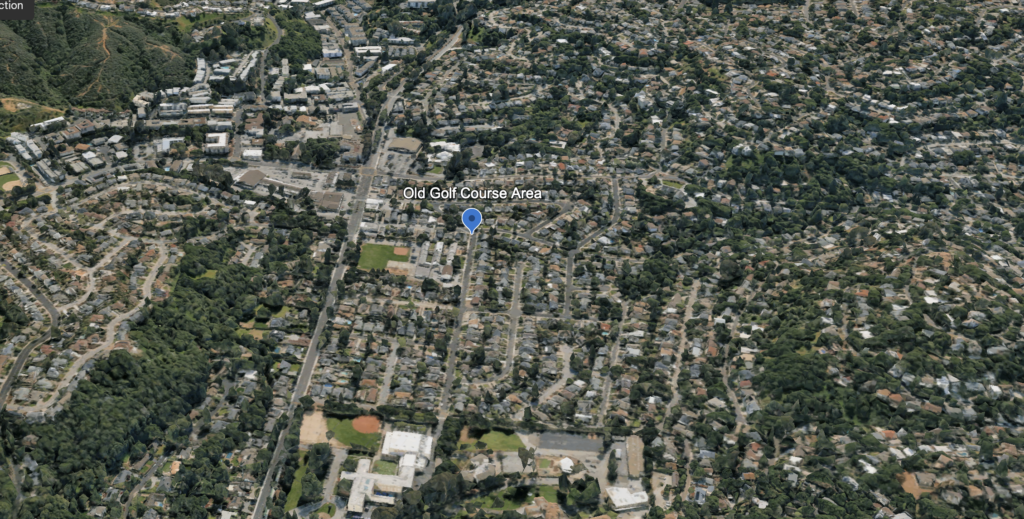
The Fairways Disappear

Today, Belmont residents may have no idea they are living on what was once a golf course.
Following World War II, housing was desperately needed for returning veterans and their families.
The fairways were subdivided.
Homes replaced greens.
Roads replaced cart paths.
The golf course quietly vanished beneath a growing suburb.
Yet clues remain for anyone willing to look.
Street names such as Fairway still hint at the land’s former purpose.
Several stately homes that once bordered the course still stand and are now listed on Belmont’s historic registry.
Like archaeological fragments, they are reminders of a forgotten chapter in Belmont’s story.
But if you know where to look, their fingerprints remain everywhere.
History has a way of disappearing quietly. Fairways become neighborhoods. Sales offices become curiosities. Names on street signs lose their stories. Yet Belmont’s past remains all around us for those willing to look a little closer. The next time you drive down Lyon Avenue, Monroe Drive, or past the round tower on Alameda de las Pulgas, remember that you’re passing through the remnants of a dream nearly one hundred years old.
As always, Thabnk for reading along…

Drew and Christine Morgan are experienced REALTORS and NOTARY PUBLIC located in Belmont, CA, where they own and operate MORGANHOMES, Inc. They have assisted buyers and sellers in their community for over 30 years. Drew and Christine have received the coveted Diamond award, ranking among the top 50 agents nationwide and the top 3 in Northern California by RE/MAX. To contact them, please call (650) 508.1441 or emailinfo@morganhomes.com.
For all you need to know about Belmont, subscribe to this blog right here. You can also follow us on Facebook and on X.
This article provides educational information and is intended for informational purposes only. It should not be considered real estate, tax, insurance, or legal advice; it cannot replace advice tailored to your situation. It’s always best to seek guidance from a professional familiar with your scenario.
BROKER | MANAGER | NOTARY

Every so often, the calendar gives us a little extra magic—and May 2026 delivers exactly that.
This month brings a rare double feature in the night sky:
Two full moons. One month. And a subtle reminder that timing—whether in nature or real estate—can change everything.

🌸 The Flower Moon: Spring at Its Peak
The Flower Moon marks the moment when spring is fully in bloom. Named for the explosion of wildflowers across North America, it’s long been associated with growth, renewal, and momentum.
Sound familiar?
In the Peninsula housing market, this is often when we see:
🔵 The Blue Moon: A Rare Second Chance
Then comes the encore.
A Blue Moon—defined as the second full moon in a calendar month—lands on May 31st. It’s where the phrase “once in a blue moon” comes from… something a little unexpected, a little rare.
And in real estate terms, it mirrors something we see all the time:
A Local Perspective
Here on the Mid-Peninsula, these moons won’t just be symbolic—they’ll be visible reminders.
Catch them rising over the Bay, glowing just above the hills of Belmont and San Carlos, and you’ll see something we’re always talking about with our clients:
The right moment isn’t always the first moment. But when it arrives—you’ll know.
Final Thoughts
Two full moons in one month are rare. So are perfectly timed opportunities.
Whether you’re watching the skies… or watching the market…
May is a month to pay attention. If you’ve been thinking about making a move, we’re always here to help you recognize when your “blue moon” moment shows up.
Helping you make good decisions—when it matters most.

Drew and Christine Morgan are experienced REALTORS and NOTARY PUBLIC located in Belmont, CA, where they own and operate MORGANHOMES, Inc. They have assisted buyers and sellers in their community for over 30 years. Drew and Christine have received the coveted Diamond award, ranking among the top 50 agents nationwide and the top 3 in Northern California by RE/MAX. To contact them, please call (650) 508.1441 or emailinfo@morganhomes.com
For all you need to know about Belmont, subscribe to this blog right here. You can also follow us on Facebook and on X.
This article provides educational information and is intended for informational purposes only. It should not be considered real estate, tax, insurance, or legal advice; it cannot replace advice tailored to your situation. It’s always best to seek guidance from a professional familiar with your scenario.
BROKER | MANAGER | NOTARY

In a move that has already begun circulating among local homeowners, the Belmont City Council is reportedly exploring a new proposal aimed at addressing what officials are referring to as “view equity.”
According to early discussion drafts, the concept centers around a potential “View Impact Fee” that would apply to homes benefiting from partial or panoramic views of the San Francisco Bay.
The rationale?
Properties with premium outlooks, particularly those capturing unobstructed Bay and Mt. Diablo views, are seen as receiving a “disproportionate benefit from shared natural resources.”
How It Would Work
While still in the exploratory phase, the proposal outlines a tiered structure:
Annual fees would reportedly scale based on view classification, with funds allocated toward:
The “View Equity” Argument
A council subcommittee is said to be evaluating how to “balance access to scenic resources” across neighborhoods.
One early draft reportedly states:
“While views are inherently tied to location and topography, the broader community contributes to the preservation and desirability of these assets.”
What This Could Mean for Homeowners
Although no formal vote has been scheduled, the concept has already sparked quiet conversations—particularly among homeowners in Belmont’s hill neighborhoods, where views are a defining feature of property value.
Some are questioning how views would be measured, how frequently classifications would be reassessed, and whether improvements (such as tree trimming or second-story additions) could impact a home’s “view tier.”
Early Takeaway
At this stage, the proposal remains informal and under review. However, it highlights an ongoing theme in Peninsula communities—how to balance property rights, natural assets, and neighborhood equity.
Oh, and Happy April Fool’s day neighbors…😉
All the Best,

About the Authors
Drew and Christine Morgan are the founders of MorganHomes, their independent brokerage based in Belmont. They also maintain a strategic affiliation with RE/MAX GOLD, combining the flexibility of an independent firm with the resources of one of the largest real estate networks.
As longtime Belmont residents and real estate professionals with more than 30 years of experience, they have helped generations of local families buy, sell, and make smart real estate decisions. Drew is also a Notary Public, providing additional convenience and support for clients when it matters most.
Their consistent performance has earned them RE/MAX’s prestigious Diamond Award, placing them among the top agents nationwide and among the top performers in Northern California.
If you have questions about the Belmont market or would like to discuss your situation, you can reach them at (650) 508-1441 or info@morganhomes.com.
For ongoing insights about Belmont real estate, local market trends, and community updates, you can subscribe to this blog or follow MorganHomes on Facebook and X.
Disclaimer
This article is provided for educational and informational purposes only. It is not intended as real estate, legal, tax, or insurance advice. Because every situation is unique, we recommend consulting with a qualified professional, like us, to understand your specific circumstances.
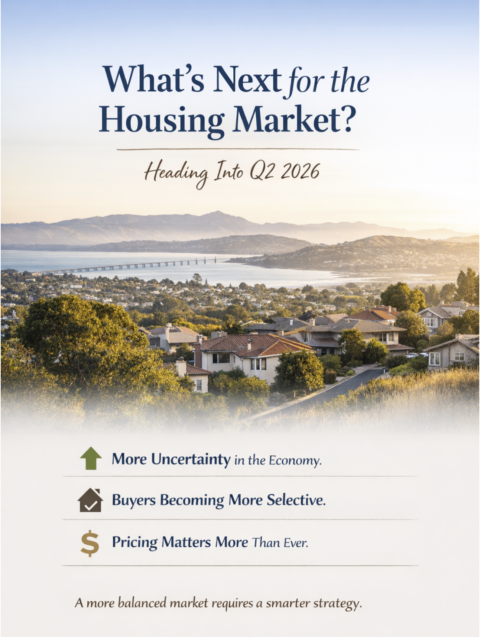
As we move into the second quarter of 2026, we’ve been getting a lot of the same question:
The honest answer is—no one can predict it with certainty. But we can look at patterns, buyer behavior, and what we’re seeing on the ground to get a pretty good sense of where things are headed.
There’s a lot going on right now that’s influencing how people feel about making big decisions:
Any one of these on its own doesn’t change the market much.
But when they all show up at once, people tend to take a step back.
In times like this, most buyers don’t panic—they pause.
Instead of rushing in, they take more of a “wait and see” approach:
In other words, the most aggressive buyers start to step back first.
So what does that look like in real life?
You’ll likely see fewer bidding wars.
Instead of 10–15 offers, it may be more like:
At the same time, buyers become more selective.
Homes that are:
…are still going to do well.
Homes with trade-offs—or pricing that feels a little too aggressive—may take longer to sell.
And overall, price growth tends to slow.
Not necessarily decline dramatically—but level off or adjust modestly.
There’s also another dynamic worth mentioning.
In uncertain times, some buyers actually lean into real estate.
They’re looking for:
But even these buyers tend to be more thoughtful.
They’re not the ones overpaying—they’re looking for value.
The Bay Area has always had some built-in support:
That doesn’t make it immune to change—but it does tend to prevent more dramatic swings.

If current trends continue, the most likely scenario is a more balanced, selective market.
The margin for error just gets smaller.
For sellers, this doesn’t eliminate opportunity—it just changes the approach.
The homes that are performing best right now are the ones that:
Where we’re seeing challenges is when homes:
That’s where momentum can get lost.
The housing market isn’t disappearing—it’s becoming more disciplined.
And in markets like this, the difference between an average result and a strong one usually comes down to:
strategy, positioning, and timing.
Frequently Asked Questions
Why are homes getting fewer offers?
Is the Bay Area housing market slowing down in 2026?
Are home prices expected to drop?
Is now a good time to sell in Belmont?
Drew and Christine Morgan are experienced REALTORS and NOTARY PUBLIC located in Belmont, CA, where they own and operate MORGANHOMES, Inc. They have assisted buyers and sellers in their community for over 30 years. Drew and Christine have received the coveted Diamond award, ranking among the top 50 agents nationwide and the top 3 in Northern California by RE/MAX. To contact them, please call (650) 508.1441 or emailinfo@morganhomes.com.
For all you need to know about Belmont, subscribe to this blog right here. You can also follow us on Facebook and on X.
This article provides educational information and is intended for informational purposes only. It should not be considered real estate, tax, insurance, or legal advice; it cannot replace advice tailored to your situation. It’s always best to seek guidance from a professional familiar with your scenario.
BROKER OWNER | MANAGER | NOTARY
Belmont Housing Market: A Little More Choice — But Still Moving Fast
We’re about two-thirds of the way through the first quarter of 2026, and the early read on the Belmont housing market is coming into focus.
Inventory has opened up modestly. So far this year, 39 homes have come to market, compared with 34 during the same period last year — about a 15% increase. Currently, there are 31 properties in the pipeline, including 19 active listings available to buyers and another 10 “coming soon” homes preparing to enter the market. Eight properties are already pending.
At first glance, the increase in listings appears to be good news for buyers. And to a degree, it is — there are slightly more choices than there were a year ago.
But the market’s pace tells a more important story.
Homes that are going pending are averaging just nine days on the market. That’s a clear signal that new inventory is being absorbed quickly. In fact, the buyers we’ve represented this year have still found themselves in highly competitive situations. On the last two homes we pursued, each drew roughly 15 offers.

That combination — more listings, but very fast absorption — suggests that demand remains strong and pricing pressure is holding firm. If the market were softening, we would expect to see homes sitting on the market longer, more price reductions, and fewer competing offers. So far, none of those conditions are showing up in the data.
It’s still early, and there haven’t been enough closed sales yet to draw firm conclusions about pricing trends for 2026. But the early indicators point to a market that remains still seller-leaning, with motivated buyers acting quickly when well-prepared homes come to market.
The takeaway: Belmont buyers may have a few more options this year — but the window to act is still short, and competition hasn’t gone away.
What this means for you depends on your timing and your strategy.
If you’re thinking about buying or selling in Belmont this year, the early trends suggest preparation and positioning matter more than ever. Sellers need to price and present their homes correctly to capture today’s fast-moving demand, and buyers need a clear plan to compete when the right property appears. If you’d like a quick, no-pressure review of your home’s current value, or a strategy session to understand your options in today’s market, feel free to reach out. We’re always happy to share what we’re seeing locally and help you make informed decisions about your next move.
About the Authors
Drew and Christine Morgan are the founders of MorganHomes, their independent brokerage based in Belmont. They also maintain a strategic affiliation with RE/MAX GOLD, combining the flexibility of an independent firm with the resources of one of the largest real estate networks.
As longtime Belmont residents and real estate professionals with more than 30 years of experience, they have helped generations of local families buy, sell, and make smart real estate decisions. Drew is also a Notary Public, providing additional convenience and support for clients when it matters most.
Their consistent performance has earned them RE/MAX’s prestigious Diamond Award, placing them among the top agents nationwide and among the top performers in Northern California.
If you have questions about the Belmont market or would like to discuss your situation, you can reach them at (650) 508-1441 or info@morganhomes.com.
For ongoing insights about Belmont real estate, local market trends, and community updates, you can subscribe to this blog or follow MorganHomes on Facebook and X.
Disclaimer
This article is provided for educational and informational purposes only. It is not intended as real estate, legal, tax, or insurance advice. Because every situation is unique, we recommend consulting with a qualified professional, like us, to understand your specific circumstances.
MorganHomes
Broker | REALTORS | Notary
DRE#01124318 | 01174047

Many people feel Proposition 19 was “snuck in” or that voters didn’t fully realize what they were agreeing to. Ever since it passed, there’s been a lot of confusion and frustration. The takeaway is that it’s essential to really understand what’s on the ballot before casting a vote.
The part that confuses most people is who Prop 19 actually impacts. The truth is, it mainly affects people who inherit a home but don’t plan to live in it themselves.
How Prop 19 Works for Inherited Homes
Why the change? It comes down to trade-offs. Prop 19 gave homeowners a valuable new benefit: the ability to transfer their low property tax base to any location in California when they move. However, to offset the cost, the state decided that heirs who use inherited property as an investment—not as a primary home—should pay property taxes based on today’s market value.
Put simply, if you live in the home, you retain most of the old exclusionary tax break. If you turn it into an income property, the state treats it like any other investment. While it may feel harsh, the intent was to make the system fairer by ensuring investors pay their share, while still protecting families who truly keep the home as their residence.
Prop 13 vs. Prop 19: Key Differences
| Feature | Proposition 13 (1978) | Proposition 19 (2020) |
| Property Tax Rate | Capped at 1% of assessed value | Still capped at 1% (Prop 19 did not change this) |
| Annual Increases | Assessed value can rise max 2% per year | Same 2% cap applies |
| Reassessment Trigger | Reassessed at market value when sold or newly built | Same rule applies |
| Parent-to-Child / Grandparent-to-Grandchild Transfers | Heirs could keep the low tax base on homes (and sometimes rentals) without limits | Heirs can keep the low tax base only if they move in and use it as their primary residence. If rented out, reassessed at market value |
| Value Limit for Inherited Homes | No value limit; heirs kept original tax base regardless of property’s market value | Tax base is kept only up to $1 million above the original assessed value (adjusted for inflation). Anything over is added to the tax base |
| Moving Low Tax Base to a New Home | Only allowed for people 55+ or disabled, and only within the same county (or limited counties) | Homeowners 55+, disabled, or wildfire victims can transfer their low tax base anywhere in California up to 3 times |
| Overall Goal | Keep property taxes stable and predictable for long-term owners | Expand portability of tax savings for older/disabled homeowners, while limiting tax breaks on inherited investment properties |
Drew and Christine Morgan are experienced REALTORS and NOTARY PUBLIC located in Belmont, CA, where they own and operate MORGANHOMES, Inc. They have assisted buyers and sellers in their community for over 30 years. Drew and Christine have received the coveted Diamond award, ranking among the top 50 agents nationwide and the top 3 in Northern California by RE/MAX. To contact them, please call (650) 508.1441 or emailinfo@morganhomes.com.
For all you need to know about Belmont, subscribe to this blog right here. You can also follow us on Facebook and on X.
This article provides educational information and is intended for informational purposes only. It should not be considered real estate, tax, insurance, or legal advice; it cannot replace advice tailored to your situation. It’s always best to seek guidance from a professional familiar with your scenario.
BROKER | MANAGER | NOTARY

Here’s a clear breakdown of what’s happening in the San Mateo County (SMC) housing market from 2024 to 2025 based on data from the MLS for Q1.
Key Highlights:
Prices & Valuation:
Volume & Sizes:
Market Dynamics:
Summary Insight:
The SMC housing market in 2025 looks like it’s in a hot but slightly more balanced phase:
Commentary: With all the uncertainty around tariffs, buyers are taking the classic “wait-and-see” approach — emphasis on the wait. One thing they’re sure of? Their stock portfolios took a hit… but hey, it’s only a loss if they cash out to buy that house, right? Yet another reason to stay on the sidelines a little longer and let the dust (and the Dow) settle.

The Risk Reward? Buy now while prices are climbing a little and bidding wars are catching their breath — or wait with the crowd for “more certain times” and join the stampede when the bidding starts up full throttle again.
Drew and Christine Morgan are experienced REALTORS and NOTARY PUBLIC located in Belmont, CA, where they own and operate MORGANHOMES, Inc. They have assisted buyers and sellers in their community for over 30 years. Drew and Christine have received the coveted Diamond award and ranked among the top 50 agents nationwide and the top 3 in Northern California by RE/MAX. To contact them, please call (650) 508.1441 or emailinfo@morganhomes.com.
For all you need to know about Belmont, subscribe to this blog right here. You can also follow us on Facebook and on Twitter.
This article provides educational information and is intended for informational purposes only. It should not be considered real estate, tax, insurance, or legal advice; it cannot replace advice tailored to your situation. It’s always best to seek guidance from a professional familiar with your scenario.
BROKER | MANAGER | NOTARY

A trend is emerging wherein sellers opt to exclusively remunerate their own agent, leaving the buyer’s agent compensation subject to negotiation by buyers.
Continue reading
Get ready to be captivated by the unveiling of the New, New housing market – a realm that has never been encountered.
Whether you’re already a homeowner or dreaming of becoming one, this end-of-year recap is your golden ticket to exploring the mesmerizing future of Peninsula Real Estate.
Brace yourself for a paradigm shift that might just redefine the real estate game for years to come.
In order to put our New, New market into perspective, a little retrospection is in order. We’re about to unravel the mystery into the feverish ride of the government’s bond-buying bonanza that kicked off in 2008, akin to a superhero swooping in to rescue the struggling housing market and economy from their doldrums but with consequences more obscured by time…
Imagine people in 2013 dancing a jig as they refinance their homes at historically low mortgage rates, hitting new lows every year. Homeowners, practically giddy, were high-fiving each other at snagging a sub 3% rate, watching their mortgage payments take a nosedive, and then going on a shopping spree for new toys like they just won the lottery.
Ah, the ironic nostalgia hits like a blast from the 1998 dot-com past. It’s like reminiscing about the Internet boom and bust, where Silicon Valley was popping champagne bottles, celebrating a new millionaire being minted every day. It was all glitz and glamour until someone finally shouted, “Hold up, is there even a ‘there’ there?
Now, we’re not claiming to be fortune-tellers, but more than a decade ago, we threw out a warning in this article. We were like, “Hey, if these rates stay low forever, everyone and their grandma will refinance or buy a home at these crazy low rates, and they might never want to move again!” It turns out we might have been onto something.

We did a fast rewind of how our housing market got here in this post back in August of 2023. Fast forward to where we are today…
The 2023 housing market results are now clear. Let’s compare the years and quarters to understand what happened:
1The decline in 2023 is emphasized by the unusual increase in home activity during the first quarter of 2022. The market in San Mateo County remained rather flat from Q4 2022 to Q4 2023.
2What is helping to keep home values steady is the short supply of homes for sale, maintaining the months of housing inventory to approximately a one-month supply.
When the government bought bonds to drive down interest rates in 2008, it was a welcome jolt to jump-start a beleaguered housing market and economy.
People could refinance to historically low mortgage rates, which seemed to reach a new low each year. Homeowners were giddy at landing a sub 3% rate, watching their mortgage payments fall by half, and snapping up new toys with their excess pocket money like drunken sailors.
Not that we’re not claiming to be prophets. Still, we were first concerned about this more than ten years ago, correctly calculating that if these low rates remained low long enough, nearly everyone would have refinanced or purchased a home with a historically low rate, which, in all likelihood, would not be seen again in our lifetime.
It didn’t take much prognosticating in our 2013 article to realize that sellers would be reticent to kiss goodbye at their sub 3% rate to get another bedroom when rates returned to historical norms.
Enter the Pillars of Movement – the mystical forces that shape the real estate universe. In our 2013 article, we saw it coming: When interest rates decide to do a head-snapping reversion to historical norms, sellers won’t be willing to bid adieu to their sub 3% rate just for an extra bedroom. And guess what’s next – the pool of potential inventory shrinks, thanks to one pillar of the housing inventory.

Yet another pillar emerges – one insulated from rate ramifications—the sellers cashing out and saying so long to the Bay Area with pockets full of cash, ready to conquer the world and buy their forever home mortgage-free.
And sure, there’s always the ebb and flow of people coming and going due to job transfers, but only some people leaving want to throw in the housing towel. Because let’s face it, once you’ve left the Bay Area, rejoining the housing game is like trying to win the lottery twice – expensive and seemingly impossible.
Now, behold the last pillar – the legacy homes. Those sacred abodes where families were raised, but now, faced with the ultimate decision for sustainability or the inevitable march of time, these homes hit the market.
As we peer into the future of 2024, a foreseen vision emerges:
Drew and Christine Morgan are experienced REALTORS and NOTARY PUBLIC in Belmont, CA. They have assisted buyers and sellers in their community for over 30 years. Drew and Christine have received the coveted Diamond award and ranked among the top 50 agents nationwide and top 3 in Northern California by RE/MAX. To contact them, please call (650) 508.1441 or email info@morganhomes.com.
For all you need to know about Belmont, subscribe to this blog right here. You can also follow us on Facebook and on Twitter.
This article provides educational information and is intended for informational purposes only. It should not be considered as real estate, tax, insurance, or legal advice, and it cannot replace advice tailored to your specific situation. It’s always best to seek guidance from a professional who is familiar with your scenario.
BROKER | MANAGER | NOTARY