The Ghosts of Belmont: A Lost Golf Course, a Round Tower, and the Men Who Left Their Names Behind
Have you ever driven through Belmont and wondered who the people behind the street names were?
Not just wondered briefly, but really wondered.
Who was Lyon? Why is there a Monroe Drive? Was Alameda de las Pulgas always called that? And what is the story behind that curious little round turret building that still stands along the roadway like something left behind from another century?
The answers are hiding in plain sight.
Every day, thousands of Belmont residents travel roads named after men they have never met, pass buildings whose original purpose has long been forgotten, and live atop land that once held dreams grand enough to rival the Peninsula’s most exclusive communities.
To uncover the mystery, we need to travel back a century.
A Grand Vision in the Wooded Hills
The year was 1925.
Belmont was still largely undeveloped, a collection of wooded hillsides and open land nestled between San Francisco and San Jose. Yet three men saw something more.
Arthur Lyon.
Lee Monroe.
Lawrence Miller.
Together they formed Belmont Country Club Properties and set out to create what they hoped would become one of the Peninsula’s most prestigious residential communities.
If those names sound familiar, they should.
Their names still appear on Belmont street signs today.
In fact, Mr. Lyon seems to have enjoyed a certain advantage in the naming process. Belmont eventually honored him twice, with both Lyon Avenue and Arthur Avenue preserving his place in local history.
Their plan was ambitious.
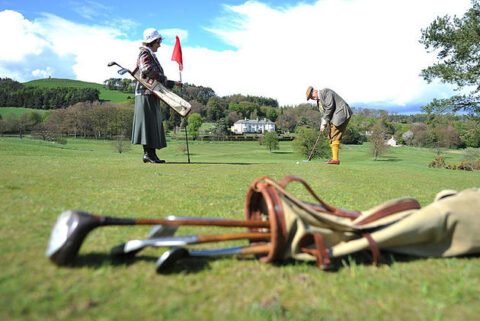
Perhaps even audacious.Imagine an elegant country club overlooking the hills, surrounded by an 18-hole golf course called Hillcrest. There would be tennis courts, handball courts, a swimming pool, a children’s wading pool, and beautifully designed homes arranged around manicured fairways.
The centerpiece would be a magnificent clubhouse named Belle Monte.
The price tag?
A staggering $65,000 in 1925.
The Round Tower Mystery
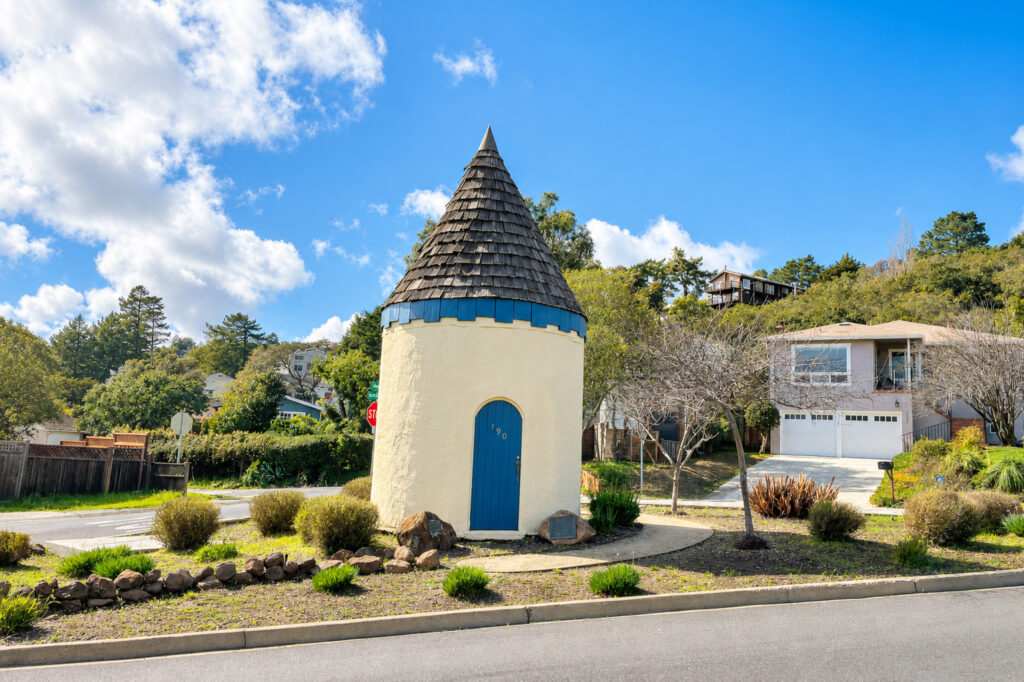
Across from the clubhouse stood an unusual little building.
Round.
Compact.
Almost whimsical.
Many Belmont residents have noticed it while driving along Alameda de las Pulgas.
Most assume it was somebody’s odd residence.
It wasn’t.
The tiny structure served as the sales office for the development.
This was where prospective buyers came to imagine their future lives among Belmont’s rolling fairways and elegant homes.
The building still survives today, quietly guarding its century-old secret while traffic rushes past.
Free Beer and Real Estate
Selling homes in the 1920s required creativity.
Or perhaps persuasion.
Belmont Country Club Properties offered free transportation from San Francisco to Belmont.
Prospective buyers would board buses, enjoy refreshments—including beer—and tour the property while salesmen painted pictures of country club living and leisurely afternoons on the golf course.
Purchase a lot and the membership in the country club was included.
For $100, residents gained access to what promised to become one of the most desirable recreational destinations on the Peninsula.
It was a marketing strategy that would probably attract attention from modern regulators.
But in the Roaring Twenties, it worked.
For a while.
The Dream Unravels
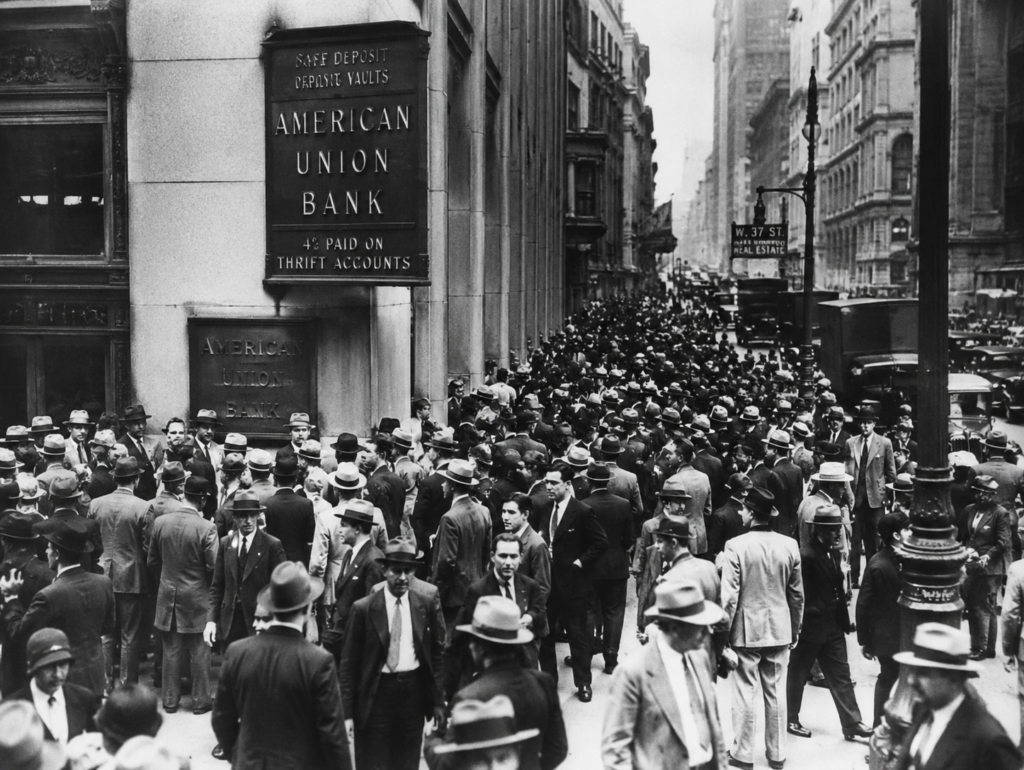
Then came 1929.
The stock market crashed.
The economy collapsed.
And Belmont’s grand experiment suddenly found itself fighting for survival.
Memberships dwindled.
Families moved away.
The developers attempted to keep the club alive by opening it to the public, but the economic forces sweeping across America proved too powerful.
The corporation eventually went bankrupt.
The dream was over.
Or so it seemed.
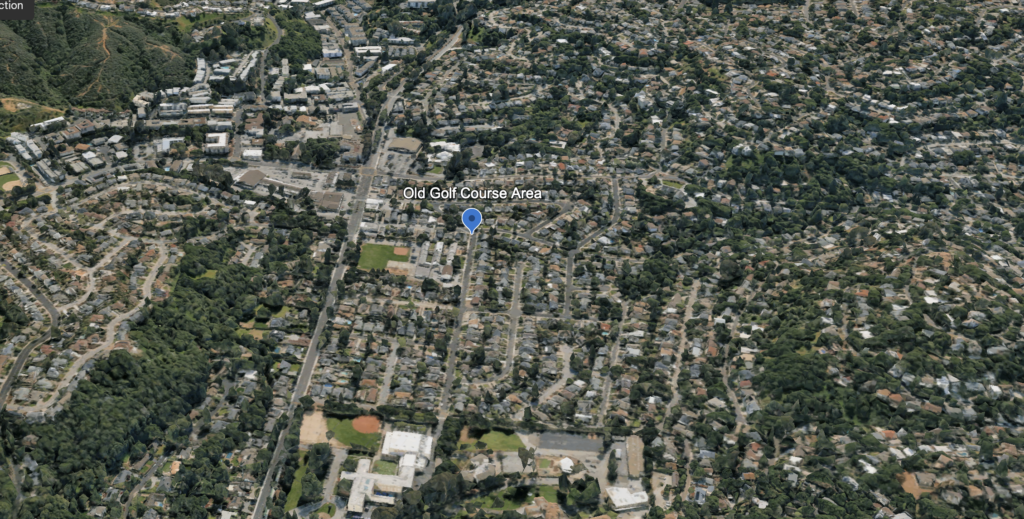
The Fairways Disappear
Today, Belmont residents may have no idea they are living on what was once a golf course.
Following World War II, housing was desperately needed for returning veterans and their families.
The fairways were subdivided.
Homes replaced greens.
Roads replaced cart paths.
The golf course quietly vanished beneath a growing suburb.
Yet clues remain for anyone willing to look.
Street names such as Fairway still hint at the land’s former purpose.
Several stately homes that once bordered the course still stand and are now listed on Belmont’s historic registry.
Like archaeological fragments, they are reminders of a forgotten chapter in Belmont’s story.
But if you know where to look, their fingerprints remain everywhere.
History has a way of disappearing quietly. Fairways become neighborhoods. Sales offices become curiosities. Names on street signs lose their stories. Yet Belmont’s past remains all around us for those willing to look a little closer. The next time you drive down Lyon Avenue, Monroe Drive, or past the round tower on Alameda de las Pulgas, remember that you’re passing through the remnants of a dream nearly one hundred years old.
As always, Thabnk for reading along…

Drew and Christine Morgan are experienced REALTORS and NOTARY PUBLIC located in Belmont, CA, where they own and operate MORGANHOMES, Inc. They have assisted buyers and sellers in their community for over 30 years. Drew and Christine have received the coveted Diamond award, ranking among the top 50 agents nationwide and the top 3 in Northern California by RE/MAX. To contact them, please call (650) 508.1441 or emailinfo@morganhomes.com.
For all you need to know about Belmont, subscribe to this blog right here. You can also follow us on Facebook and on X.
This article provides educational information and is intended for informational purposes only. It should not be considered real estate, tax, insurance, or legal advice; it cannot replace advice tailored to your situation. It’s always best to seek guidance from a professional familiar with your scenario.
BROKER | MANAGER | NOTARY