Belmont City Council Quietly Exploring “View Impact Fee” for Certain Homes

Belmont View Fee

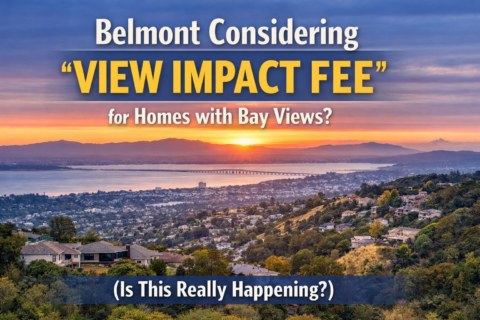
In a move that has already begun circulating among local homeowners, the Belmont City Council is reportedly exploring a new proposal aimed at addressing what officials are referring to as “view equity.”

According to early discussion drafts, the concept centers around a potential “View Impact Fee” that would apply to homes benefiting from partial or panoramic views of the San Francisco Bay.

The rationale?
Properties with premium outlooks, particularly those capturing unobstructed Bay and Mt. Diablo views, are seen as receiving a “disproportionate benefit from shared natural resources.”


How It Would Work

While still in the exploratory phase, the proposal outlines a tiered structure:

  • Tier 1: Glimpses of the Bay
  • Tier 2: Partial Bay views
  • Tier 3: Panoramic or unobstructed views

Annual fees would reportedly scale based on view classification, with funds allocated toward:

  • “Community aesthetic enhancements”
  • Tree canopy management programs
  • Public viewpoint improvements

The “View Equity” Argument

A council subcommittee is said to be evaluating how to “balance access to scenic resources” across neighborhoods.

One early draft reportedly states:

“While views are inherently tied to location and topography, the broader community contributes to the preservation and desirability of these assets.”


What This Could Mean for Homeowners

Although no formal vote has been scheduled, the concept has already sparked quiet conversations—particularly among homeowners in Belmont’s hill neighborhoods, where views are a defining feature of property value.

Some are questioning how views would be measured, how frequently classifications would be reassessed, and whether improvements (such as tree trimming or second-story additions) could impact a home’s “view tier.”


Early Takeaway

At this stage, the proposal remains informal and under review. However, it highlights an ongoing theme in Peninsula communities—how to balance property rights, natural assets, and neighborhood equity.

All the Best,

Drew & Christine Signature

About the Authors

Drew and Christine Morgan are the founders of MorganHomes, their independent brokerage based in Belmont. They also maintain a strategic affiliation with RE/MAX GOLD, combining the flexibility of an independent firm with the resources of one of the largest real estate networks.

As longtime Belmont residents and real estate professionals with more than 30 years of experience, they have helped generations of local families buy, sell, and make smart real estate decisions. Drew is also a Notary Public, providing additional convenience and support for clients when it matters most.

Their consistent performance has earned them RE/MAX’s prestigious Diamond Award, placing them among the top agents nationwide and among the top performers in Northern California.

If you have questions about the Belmont market or would like to discuss your situation, you can reach them at (650) 508-1441 or info@morganhomes.com.

For ongoing insights about Belmont real estate, local market trends, and community updates, you can subscribe to this blog or follow MorganHomes on Facebook and X.


Disclaimer

This article is provided for educational and informational purposes only. It is not intended as real estate, legal, tax, or insurance advice. Because every situation is unique, we recommend consulting with a qualified professional, like us, to understand your specific circumstances.

Thinking About Selling or Buying in this year? Here’s What We’re Seeing Locally

Bay Area Homes

As we move into the second quarter of 2026, we’ve been getting a lot of the same question:

The honest answer is—no one can predict it with certainty. But we can look at patterns, buyer behavior, and what we’re seeing on the ground to get a pretty good sense of where things are headed.


There’s a lot going on right now that’s influencing how people feel about making big decisions:

  • Interest rates have moved higher
  • The cost of goods and services continues to rise
  • There’s more global uncertainty than we’ve seen in a while
  • The job market is shifting
  • And consumer confidence, which had been improving, is starting to soften

Any one of these on its own doesn’t change the market much.
But when they all show up at once, people tend to take a step back.


In times like this, most buyers don’t panic—they pause.

Instead of rushing in, they take more of a “wait and see” approach:

  • They become more cautious
  • They look more closely at value
  • They’re less willing to stretch beyond their comfort zone

In other words, the most aggressive buyers start to step back first.


So what does that look like in real life?

You’ll likely see fewer bidding wars.
Instead of 10–15 offers, it may be more like:

  • 2–5 offers on strong homes
  • And sometimes just one solid, well-qualified buyer

At the same time, buyers become more selective.

Homes that are:

  • Well-priced
  • Move-in ready
  • In strong locations

…are still going to do well.

Homes with trade-offs—or pricing that feels a little too aggressive—may take longer to sell.

And overall, price growth tends to slow.
Not necessarily decline dramatically—but level off or adjust modestly.


There’s also another dynamic worth mentioning.

In uncertain times, some buyers actually lean into real estate.
They’re looking for:

  • Stability
  • Something tangible
  • A long-term place to land

But even these buyers tend to be more thoughtful.
They’re not the ones overpaying—they’re looking for value.


The Bay Area has always had some built-in support:

  • Limited housing supply
  • A strong base of high-income buyers
  • Long-term demand for homeownership

That doesn’t make it immune to change—but it does tend to prevent more dramatic swings.


If current trends continue, the most likely scenario is a more balanced, selective market.

  • Buyers are still there—but more cautious
  • Competition still happens—but not as consistently
  • And pricing becomes more important than ever

The margin for error just gets smaller.


For sellers, this doesn’t eliminate opportunity—it just changes the approach.

The homes that are performing best right now are the ones that:

  • Are priced strategically from the start
  • Show well and feel move-in ready
  • Line up with what buyers are expecting today

Where we’re seeing challenges is when homes:

  • Start too high
  • Rely on past peak comps
  • Or assume buyers will stretch the way they did before

That’s where momentum can get lost.


The housing market isn’t disappearing—it’s becoming more disciplined.

And in markets like this, the difference between an average result and a strong one usually comes down to:

strategy, positioning, and timing.

Drew & Christine Signature

Frequently Asked Questions

Why are homes getting fewer offers?

Is the Bay Area housing market slowing down in 2026?

Are home prices expected to drop?

Is now a good time to sell in Belmont?

Drew and Christine Morgan are experienced REALTORS and NOTARY PUBLIC located in Belmont, CA, where they own and operate MORGANHOMES, Inc. They have assisted buyers and sellers in their community for over 30 years. Drew and Christine have received the coveted Diamond award, ranking among the top 50 agents nationwide and the top 3 in Northern California by RE/MAX. To contact them, please call (650) 508.1441 or emailinfo@morganhomes.com.

For all you need to know about Belmont, subscribe to this blog right here. You can also follow us on Facebook and on X.

This article provides educational information and is intended for informational purposes only. It should not be considered real estate, tax, insurance, or legal advice; it cannot replace advice tailored to your situation. It’s always best to seek guidance from a professional familiar with your scenario.

BROKER OWNER | MANAGER | NOTARY

Inherited a Home in California? Here’s How Proposition 19 Could Change the Property Taxes

Recently, we were contacted by two families who had inherited their parents’ homes after the passing of the surviving parent. Unfortunately, in both situations, they had not spoken with a real estate professional beforehand, and it appears their attorney may not have been fully up to date on the newer rules.

Both families intended to move into the homes they inherited. However, because certain steps required under California’s Proposition 19 were not completed in time, the properties were reassessed to the current market value for property tax purposes.

As a result, these families—who otherwise would have been able to move into their parents’ homes and retain a much lower tax base—are now facing significantly higher property taxes. In some cases, increases like this can be financially overwhelming, leaving heirs with the difficult choice of either paying the new, higher property tax or selling the property despite wishing to reside in the home.

We felt this was important enough to bring to people’s attention, as these rules can have a major impact on families inheriting property in California. Understanding the requirements ahead of time can help prevent costly surprises and ensure that the available benefits are preserved.

How Proposition 19 Affects Children Inheriting Their Parents’ Property

California’s Proposition 19 significantly changed how property taxes are handled when children inherit real estate from their parents.

For decades under Proposition 58, children could inherit property and keep the parent’s low property tax base—even if the home became a rental or second home. Proposition 19 narrowed those rules considerably.

The New Rules

If a child inherits a parent’s home, the property tax base can only be preserved if three conditions are met:

1. The home must become the child’s primary residence.
The child must move into the property and claim the Homeowners’ Exemption. If the home is kept as a rental, second home, or investment property, it will generally be reassessed to current market value.

2. The tax base transfer now has a limit.
The inherited property can keep the parent’s tax base only up to $1,000,000 above the parent’s assessed value. If the home’s market value exceeds that threshold, the amount above the limit is added to the property’s taxable value.

3. The claim must be filed within one year.
The heir must file the parent-child exclusion claim with the county assessor within one year of the transfer (usually the date of death). If this deadline is missed, the property may be reassessed to the current market value, which can significantly increase the property taxes.

➡︎ This is where many people make costly mistakes. Some heirs never file the claim at all, others miss the one-year deadline, and many confuse it with the two-year window that applies when homeowners transfer their own tax base to a replacement home (see that rule below), under Proposition 19. Understanding the difference is critical to preserving the lower property tax base.

Why This Matters

Many California homeowners purchased their homes decades ago, meaning their taxable value may be far below current market prices. Under Proposition 19, heirs must now decide whether to move into the property, sell it, or accept a potentially large increase in property taxes.

For families planning estates—or for heirs inheriting property—understanding these rules is critical to avoiding unexpected tax consequences.

✓ Carrying Your Property Tax Base to a New Home [Here’s an online calculator]

Another important provision of Proposition 19 allows certain homeowners to transfer their existing property tax base to a new home when they sell their current one.

Homeowners who are 55 or older, severely disabled, or victims of a natural disaster may transfer the taxable value of their current residence to a replacement home anywhere in California. This can significantly reduce property taxes when downsizing or relocating.

To qualify, the replacement home must be purchased or newly constructed within two years of selling the original property.

After purchasing the replacement property, the homeowner should file the Base Year Value Transfer Claim with the county assessor. While the claim can typically be filed up to three years after purchasing the replacement home, filing sooner ensures the tax benefit is applied from the beginning of ownership.

Understanding these timing rules can help homeowners preserve substantial property tax savings when moving to a new home.

Proposition 19 has introduced rules that many families are still learning about—often after the fact. As we’ve seen recently, missing a deadline or not understanding the requirements can lead to property tax increases that could have been avoided with a little planning.

If you or someone in your family may be inheriting a property, or if you are considering selling and transferring your tax base to another home, taking a few minutes to understand the rules ahead of time can make a meaningful difference. If we can ever be a resource to help clarify how these changes may affect you, we are always happy to help.

Other Articles:

About the Authors

Drew and Christine Morgan are the founders of MorganHomes, their independent brokerage based in Belmont. They also maintain a strategic affiliation with RE/MAX GOLD, combining the flexibility of an independent firm with the resources of one of the largest real estate networks.

As longtime Belmont residents and real estate professionals with more than 30 years of experience, they have helped generations of local families buy, sell, and make smart real estate decisions. Drew is also a Notary Public, providing additional convenience and support for clients when it matters most.

Their consistent performance has earned them RE/MAX’s prestigious Diamond Award, placing them among the top agents nationwide and among the top performers in Northern California.

If you have questions about the Belmont market or would like to discuss your situation, you can reach them at (650) 508-1441 or info@morganhomes.com.

For ongoing insights about Belmont real estate, local market trends, and community updates, you can subscribe to this blog or follow MorganHomes on Facebook and X.


Disclaimer

This article is provided for educational and informational purposes only. It is not intended as real estate, legal, tax, or insurance advice. Because every situation is unique, we recommend consulting with a qualified professional, like us, to understand your specific circumstances.

The Belmont Market Is Moving Fast — Are You Positioned to Take Advantage?

Belmont From Above

Belmont Housing Market: A Little More Choice — But Still Moving Fast

We’re about two-thirds of the way through the first quarter of 2026, and the early read on the Belmont housing market is coming into focus.

Inventory has opened up modestly. So far this year, 39 homes have come to market, compared with 34 during the same period last year — about a 15% increase. Currently, there are 31 properties in the pipeline, including 19 active listings available to buyers and another 10 “coming soon” homes preparing to enter the market. Eight properties are already pending.

At first glance, the increase in listings appears to be good news for buyers. And to a degree, it is — there are slightly more choices than there were a year ago.

But the market’s pace tells a more important story.

Homes that are going pending are averaging just nine days on the market. That’s a clear signal that new inventory is being absorbed quickly. In fact, the buyers we’ve represented this year have still found themselves in highly competitive situations. On the last two homes we pursued, each drew roughly 15 offers.

That combination — more listings, but very fast absorption — suggests that demand remains strong and pricing pressure is holding firm. If the market were softening, we would expect to see homes sitting on the market longer, more price reductions, and fewer competing offers. So far, none of those conditions are showing up in the data.

It’s still early, and there haven’t been enough closed sales yet to draw firm conclusions about pricing trends for 2026. But the early indicators point to a market that remains still seller-leaning, with motivated buyers acting quickly when well-prepared homes come to market.

The takeaway: Belmont buyers may have a few more options this year — but the window to act is still short, and competition hasn’t gone away.

What this means for you depends on your timing and your strategy.
If you’re thinking about buying or selling in Belmont this year, the early trends suggest preparation and positioning matter more than ever. Sellers need to price and present their homes correctly to capture today’s fast-moving demand, and buyers need a clear plan to compete when the right property appears. If you’d like a quick, no-pressure review of your home’s current value, or a strategy session to understand your options in today’s market, feel free to reach out. We’re always happy to share what we’re seeing locally and help you make informed decisions about your next move.

About the Authors

Drew and Christine Morgan are the founders of MorganHomes, their independent brokerage based in Belmont. They also maintain a strategic affiliation with RE/MAX GOLD, combining the flexibility of an independent firm with the resources of one of the largest real estate networks.

As longtime Belmont residents and real estate professionals with more than 30 years of experience, they have helped generations of local families buy, sell, and make smart real estate decisions. Drew is also a Notary Public, providing additional convenience and support for clients when it matters most.

Their consistent performance has earned them RE/MAX’s prestigious Diamond Award, placing them among the top agents nationwide and among the top performers in Northern California.

If you have questions about the Belmont market or would like to discuss your situation, you can reach them at (650) 508-1441 or info@morganhomes.com.

For ongoing insights about Belmont real estate, local market trends, and community updates, you can subscribe to this blog or follow MorganHomes on Facebook and X.


Disclaimer

This article is provided for educational and informational purposes only. It is not intended as real estate, legal, tax, or insurance advice. Because every situation is unique, we recommend consulting with a qualified professional, like us, to understand your specific circumstances.

MorganHomes
Broker | REALTORS | Notary

DRE#01124318 | 01174047

Proposition 19 vs 13−Confusion Continues to Abound

Many people feel Proposition 19 was “snuck in” or that voters didn’t fully realize what they were agreeing to. Ever since it passed, there’s been a lot of confusion and frustration. The takeaway is that it’s essential to really understand what’s on the ballot before casting a vote.

The part that confuses most people is who Prop 19 actually impacts. The truth is, it mainly affects people who inherit a home but don’t plan to live in it themselves.

How Prop 19 Works for Inherited Homes

  1. If You Move In
    • If you inherit a family home and make it your primary residence, you can keep the low property tax base your parent or grandparent had.
    • But there’s a limit: if the market value is more than $1 million higher than the old taxable value, the amount above that gets added to your new tax base.
    • Example: If the old taxable value was $300,000 and the home is worth $1.6M when transferred, the new taxable value becomes $600,000. Unaffordable? Remember, these inherited homes typically come with no mortgage payment.
  2. If You Rent It Out
    • If you inherit a property and don’t live in it (for example, you turn it into a rental), it’s reassessed at full market value. That means you lose the lower tax base your parent or grandparent had.

Why the change? It comes down to trade-offs. Prop 19 gave homeowners a valuable new benefit: the ability to transfer their low property tax base to any location in California when they move. However, to offset the cost, the state decided that heirs who use inherited property as an investment—not as a primary home—should pay property taxes based on today’s market value.

Put simply, if you live in the home, you retain most of the old exclusionary tax break. If you turn it into an income property, the state treats it like any other investment. While it may feel harsh, the intent was to make the system fairer by ensuring investors pay their share, while still protecting families who truly keep the home as their residence.

Prop 13 vs. Prop 19: Key Differences

FeatureProposition 13 (1978)Proposition 19 (2020)
Property Tax RateCapped at 1% of assessed valueStill capped at 1% (Prop 19 did not change this)
Annual IncreasesAssessed value can rise max 2% per yearSame 2% cap applies
Reassessment TriggerReassessed at market value when sold or newly builtSame rule applies
Parent-to-Child / Grandparent-to-Grandchild TransfersHeirs could keep the low tax base on homes (and sometimes rentals) without limitsHeirs can keep the low tax base only if they move in and use it as their primary residence. If rented out, reassessed at market value
Value Limit for Inherited HomesNo value limit; heirs kept original tax base regardless of property’s market valueTax base is kept only up to $1 million above the original assessed value (adjusted for inflation). Anything over is added to the tax base
Moving Low Tax Base to a New HomeOnly allowed for people 55+ or disabled, and only within the same county (or limited counties)Homeowners 55+, disabled, or wildfire victims can transfer their low tax base anywhere in California up to 3 times
Overall GoalKeep property taxes stable and predictable for long-term ownersExpand portability of tax savings for older/disabled homeowners, while limiting tax breaks on inherited investment properties

Drew and Christine Morgan are experienced REALTORS and NOTARY PUBLIC located in Belmont, CA, where they own and operate MORGANHOMES, Inc. They have assisted buyers and sellers in their community for over 30 years. Drew and Christine have received the coveted Diamond award, ranking among the top 50 agents nationwide and the top 3 in Northern California by RE/MAX. To contact them, please call (650) 508.1441 or emailinfo@morganhomes.com.

For all you need to know about Belmont, subscribe to this blog right here. You can also follow us on Facebook and on X.

This article provides educational information and is intended for informational purposes only. It should not be considered real estate, tax, insurance, or legal advice; it cannot replace advice tailored to your situation. It’s always best to seek guidance from a professional familiar with your scenario.

BROKER | MANAGER | NOTARY

San Mateo County Housing Market: Rising Demand, Shrinking Supply, and Hidden Value Gains

San Mateo County Housing Market Snapshot: A Mixed Bag of Growth and Decline

The Q3 2024 housing market in San Mateo County reveals notable shifts compared to the same quarter in 2023. While total sales volume and median sale prices increased, other key indicators suggest tightening market dynamics.

Sales Surge Amid Reduced Inventory: The number of homes sold increased by 7.7%, rising from 902 to 977, likely due to strong demand despite the dropping number of new listings. This is reflected in the lower inventory levels—the inventory of homes that haven’t sold by the end of a month.

Pricing Trends Show Hidden Results

Median sale prices grew by 4.5%, reaching $1,908,700. At the same time, the cost per square foot climbed 5.2% to $1,149.

Smaller Lots, Bigger Gains

In Q3 2024, lot sizes shrank 24.7% (15,606 to 12,514 sq. ft.), and home sizes dropped 4.7% (to 2,012 sq. ft.). These shifts skew the reported appreciation, as smaller homes on smaller lots sold for 5.2% more. Adjusting for size differences and price per square foot ($60.00), the true median price appreciation is closer to 15.1% year-over-year.

Price Per Square Foot Climbs Nearly 9% The average price per square foot rose sharply, jumping 8.8% from $865 to $949. This uptick underscores rising property values and increased buyer competition. Higher demand, coupled with limited supply, is driving prices higher on a per-square-foot basis, a clear sign of a strengthening market. If inventory constraints remain, expect this trend to persist.

Faster Sales, Fewer Days on Market: Homes sold quicker in 2024, with the average days on market (DOM) dropping from 24 to 23 days, a minuscule 4.3% improvement. This indicates continued competition for available homes.

Strong Pricing Power: Sellers continued to receive more than asking prices, with the percentage of list price received improving to 105%, up 1%.

Total Sales Volume Climbs: The market saw a 5.9% increase in sales volume, reaching $2.35 billion, signaling robust overall growth.

Tighter Months of Inventory: The months of inventory dropped to 1.6, reflecting a 12.5% tightening, signaling a shift toward a stronger seller’s market.

In summary, Q3 2024 shows an increasingly competitive market with rising demand and constrained supply. While buyers face higher prices and smaller lots, sellers benefit from faster sales and strong pricing power. If inventory remains low, expect continued price pressures.

Drew and Christine Morgan are experienced REALTORS and NOTARY PUBLIC located in Belmont, CA, where they own and operate MORGANHOMES, Inc. They have assisted buyers and sellers in their community for over 30 years. Drew and Christine have received the coveted Diamond award and ranked among the top 50 agents nationwide and the top 3 in Northern California by RE/MAX. To contact them, please call (650) 508.1441 or email info@morganhomes.com.

For all you need to know about Belmont, subscribe to this blog right here. You can also follow us on Facebook and on Twitter.

This article provides educational information and is intended for informational purposes only. It should not be considered real estate, tax, insurance, or legal advice, and it cannot replace advice tailored to your specific situation. It’s always best to seek guidance from a professional who is familiar with your scenario.

BROKER | OWNER | NOTARY

Real Estate Boom: San Mateo and Belmont See Surge in Home Prices and Sales in 2024

“We’re seeing the strongest market conditions since the beginning of 2022…”

Continue reading

Recognizing the Flaws in Comparing Year-Over-Year Data

Back in November 2022, we wrote an article titled “The Big Risk in Gambling on Bay Area Home Values” where we predicted that this day would come. We expected that Q1 in 2023 would see a significant decrease when compared to 2022 but are we comparing apples to apples? We suspect that by Fall, the year-over-year changes will be more accurate since the first three months of 2022 were an anomaly due to a surge in home prices (not values).

Last year in April, the Bay Area housing market reached its highest point, driven by the fear of impending interest rate hikes. However, since May 2022, there has been a decline in the market. The decline can be attributed to the interest rate increases, which ironically is what led to an increase in housing values in the first quarter of 2021.

This unsustainable and rather sudden ramp-up in bidding wars, and consequently home values, ended rather abruptly in mid-April.

The May sales data reflected the change in home-buying activity, and the shift in the market was in full swing by June. We discussed this in our blog post titled “Bay Area Housing Market on Precipice of Unpredictable Change.”

Currently, in San Mateo County, home values have reverted to levels seen in August of 2022.

Comparing the months of April YOY for San Mateo County, the dramatic shift is seen across the board in almost every category. 

Fewer sellers are willing to sell in today’s market because as most have locked into fixed-rate loans in the 3% (or even less) range. 

With fewer sellers willing to move, the number of new listings is down 38%. In any other market, this alone would create a shortage of inventory of homes for sale which in turn would drive up prices. However, the higher interest rates that are keeping sellers in their homes longer, are also eroding the purchasing power of buyers. This is helping to keep our market near equilibrium—a state which historically is rarely seen, and if so, never for very long.

We notice a similar trend in the city of Belmont, but it’s more pronounced because the sample size is small, which makes fluctuations more noticeable.

Opposite the Law of Large Numbers, a foundational concept in statistics that if a sample is large enough, the sample average should be close to the mean, the law of small numbers provides us with a “Belief in the Law of Small Numbers.” In their paper, Kahneman and Tversky—who famously explored human heuristics, define the Law of Small Numbers as the mistaken belief that a small sample accurately reflects the probabilities of a population. In small data sets, you can find patterns where none exist!

Such is often true when isolating the numbers for home sales in Belmont.

Here we note the magnified effect of the market as compared to San Mateo County as a whole.

That said, there’s no doubt about the YOY change. In 2023 the size homes that sold were 22.5% larger, yet sold for 7.7% less, indicating the true YOY value shift to be close to a 30% drop.

The average time it takes to sell a house has increased by 200%, which shows that buyers are becoming pickier. However, it’s also happening because many sellers are still setting their prices based on past market conditions and pricing their homes too high.

It’s unfortunate that some agents prioritize making a sale over being honest with the sellers. They may tell the sellers what they want to hear, instead of what they need to know. Additionally, sellers often choose agents based solely on the price estimate the agent gives them for their home, which perpetuates this behavior.

At present, the inventory of homes available for sale is only enough to last for about a month. This is a notable decrease from the 9.5 months of inventory during the 2008 economic crisis.

As we move past April, the monthly figures will gradually approach and eventually exceed the year-over-year numbers of 2023. However, we do not anticipate this to occur until the year 2024.

It is imperative that you price your home correctly if you are considering selling it. This holds especially true in the current market. Do not hesitate to contact us for an honest evaluation.

Drew and Christine Morgan are experienced REALTORS and NOTARY PUBLIC located in Belmont, CA. They have been assisting buyers and sellers in their community for over 30 years. Drew and Christine have received the coveted Diamond award and ranked among the top 50 agents nationwide and top 3 in Northern California by RE/MAX. To contact them, please call (650) 508.1441 or email info@morganhomes.com.

or all you need to know about Belmont, subscribe to this blog right here. You can also follow us on Facebook and on Twitter.

This article provides educational information and is intended for informational purposes only. It should not be considered as real estate, tax, insurance, or legal advice, and it cannot replace advice tailored to your specific situation. It’s always best to seek guidance from a professional who is familiar with your scenario.

The Illusion of Year of Year Numbers

Housing Sector Finally in Balance?

It seems like forever since the housing market has been in balance. The downturn in 2007-2009 was followed in 2012 by an 11-year run up in Bay Area home values. Are we finally reaching equilibrium?

The first quarter of 2023 is in the books, and the housing numbers are in. If you’ve been listening to local news, one might believe the housing market is on a slippery slope and headed towards a trough.

The numbers sure make it look that way too, but is there more to report? The short answer is, there always is.

Looking at San Mateo County as a whole, here are the YOY (Year over Year) numbers comparing 2022 to 2023:

In every category the numbers appear to indicate that we’re in a declining or buyer’s market, but we’re not. Why?

Half of the homes are still selling for over asking, while the other half are selling for less, which is strongly indicative of a market in balance. Take a look at these graphs we prepare–they show the market is beginning to level out.

NEW LISTINGS

This number is down because sellers with 3% interest rates are reticent to sell their current home only to find their new mortgage on a replacement property closer to 6%. This decline was amplified by the historically inclement weather.

INVENTORY

This is a measurement of how many homes remained for sale at the end of the measured period. This is showing us there were fewer homes left over at the end of the quarter, which didn’t sell.

SOLD HOMES

The number of sold homes is actually very close to the number of fewer homes that were listed for sale. It’s like a car lot—if they have fewer cars on their lot to sell, they’ll sell fewer cars. In 2023, note that there were ~36% fewer homes available for sale, but only 31% fewer sales, which is consistent with the inventory of remaining homes being lower in 2023.

AVERAGE DOM

Homes are taking longer to sell. While there are fewer homes to choose from, there are also fewer buyers that are willing to purchase a home—creating for the first time in a long time, a balance in supply and demand.

A side note on why homes are taking longer to sell is twofold—sellers who are in denial that they missed the peak price point from 2022, and agents who have never worked in a more regular market, and will take any listing at any price also in denial that the market has changed.

The days of an on average six-day period of marketing are gone for the foreseeable future. In fact, six days on the market was also an anomaly. Last year at this time six days was all that was needed to sell a home with the incredible amount of urgency to beat rate hikes. In 2021 for example, the days on market during this period was 25. This year it’s at 32—higher, but again not astoundingly.

MEDIAN SALE PRICE

The median sale price is for the entire county, so what may be happening in your city or even neighborhood is probably different. 

The YOY drop of 11.8% from 2022 and the Price per Square Foot drop of 11.4% are fairly close to each other indicting that this can be considered to be a reliable measurement of the drop in home values between these two periods. If these two categories were off by a substantial amount, it would indicate a shift to smaller or larger homes selling in the two periods. We frequently run into this type of shift when measuring small market samples in smaller cities and when looking at only one month of sales for example.

THE INSIDE SCOOP

Here’s where it gets interesting. While the media may be accurately reporting these numbers, they do not put them into perspective, which in some cases such as this, a whole new story emerges.

Misleading Interpretations of the Housing Market

This is a classic example of a financial group trying to interpret the data and missing the mark on several key points.

In fact, the median homes prices are lower, and they should be, because they are being compared to Q1 in 2022 which saw the fastest run up in home values in the history of the Bay Area (see next paragraph for a deeper dive). We did an article on why this happened last year and predicted that this year would pale in comparison and exacerbate the apparent decline in values—which is exactly what happened.

We also went on to forecast that once we get past the May numbers in 2022—when the April sales of 2022 peaked and were reported—we may see an actual YOY increase in 2023 over 2022 as the summer and fall approaches, as that’s when in 2022 home prices began to decline.

LIST PRICE TO SALE PRICE RATIO—Making Sense of it All

The decrease in multiple offers has clearly has an impact on homes selling for over their asking price, as seen in recent, previous years. 

While homes sold on average for 114% of asking in Q1 of 2022—that wasn’t normal—it was an anomaly. 

It was due to the sudden demand in housing in 2022 fueled by the fear of looming interest rate hikes. Looking at the same period in 2022—January through April—homes sold for on average 106% of asking in 2021. In 2023 the percentage over asking was 101%—so eliminating the frenzied run up in 2022, the percent over asking is still lower than average, but by only 5 points instead of 11.

MONTHS OF INVENTORY—What does that mean?

The Months of Inventory statistic shows us, at the current rate of homes sales, how long it would take to sell the current inventory of homes.

A normal Months of Inventory, if we average San Mateo County’s inventory levels dating back to 1998, is 2.6 months. Nationwide wide they hover around six months of inventory. 

During the financial crises of 2007-2009—from peak to trough the inventory levels of homes for sale in San Mateo County stood at 5.2 months.

In Q1 of 2022 they were only 1.3=2 months of inventory and that has bumped up to 1.7—still far below historical averages.

Locally, the story is much the same in our two of Belmont, but, since the sample size is so much smaller, the swings in statistical categories can appear skewed, and over or underrepresent the overall housing pattern in the Bay Area.

Belmont Home Prices

The Take-Away

  • In San Mateo County, the housing market has slowed from its Q1 2022 peak.
  • If the economy stays the way it is now, in Q2 the YOY numbers will be more similar.
  • We expect to see demand increase for housing as buyers become accustomed to higher interest rates.
  • We imagine that in Q3 the median home value may be similar to 2002.
  • The historical inclement weather has kept a lid on new listings—we expect this to increase as weather improves. More homes for sale will keep a ceiling on home appreciation as the market shift deeper into buyer territory.
  • The stats show the market shift in the buyer’s favor has created a more balanced housing market.
  • There is no metric that compares to the financial crisis housing depreciation in 2007-2009

Drew & Christine Morgan are REALTORS/NOTARY PUBLIC in Belmont, CA. with more than 30 years of experience in helping sellers and buyers in their community. As Diamond recipients, Drew and Christine ranked in the top 50 RE/MAX agents nationwide and the top 3 in Northern California.  They may be reached at (650) 508.1441 or emailed at info@morganhomes.com.

For all you need to know about Belmont, subscribe to this blog right here. You can also follow us on Facebook and on Twitter.

The information contained in this article is educational and intended for informational purposes only. It does not constitute real estate, tax, insurance or legal advice, nor does it substitute for advice specific to your situation. Always consult an appropriate professional familiar with your scenario.