Finding homes online is easy. Determining whether a home is truly worth the price, understanding disclosures, identifying potential risks, and negotiating favorable terms requires experience. Learn how working with an experienced Broker can help you make informed decisions and avoid costly mistakes when buying a home.
One of the biggest mistakes home buyers make is assuming a home’s asking price is the same as its market value.
In reality, the asking price is simply the price a seller chooses to advertise. Market value, on the other hand, is what a knowledgeable and willing buyer is likely to pay in the current market.
Understanding the difference can help you avoid overpaying, missing opportunities, or becoming frustrated when homes sell for more—or less—than their asking prices.
What Is an Asking Price?
The asking price is the amount a seller places on a property when it is offered for sale.
Think of it as an invitation to the marketplace rather than a statement of value.
A seller may choose an asking price based on:
Recent comparable sales
Advice from their real estate agent
Current market conditions
Personal financial goals
Pricing strategy for multiple offers
The asking price may be higher, lower, or very close to the property’s actual market value.
What Is Market Value?
Market value is the price a buyer and seller agree upon when neither is under pressure and both have reasonable knowledge of the market.
In simple terms, market value is what the market is willing to pay today.
Market value is influenced by:
Location
Lot size
Square footage
Condition
Upgrades
School districts
Views
Market conditions
Buyer demand
Available inventory
Because these factors constantly change, market value changes as well.
Why Do Some Homes Sell Above Asking Price?
In competitive markets such as Belmont, it’s common to see homes sell above the advertised price.
This usually occurs because the seller intentionally priced the home below market value to attract more buyers and generate competition.
For example:
A Belmont home may be listed for $1,998,000.
After receiving multiple offers, it may ultimately sell for $2,250,000.
Did the home increase in value overnight?
No.
The asking price was simply part of the seller’s marketing strategy.
Why Do Some Homes Sell Below Asking Price?
The opposite can happen as well.
A seller may overestimate the property’s value or list the home aggressively to test the market.
If buyers believe the asking price exceeds market value, the home may sit on the market and eventually sell for less.
For example:
A home may be listed at $2,500,000.
After several price reductions and limited buyer interest, it may sell for $2,250,000.
In this case, the market—not the seller—determined the property’s value.
Online Estimates Are Only Estimates
Many buyers begin their search using online valuation tools.
While these estimates can provide a rough starting point, they often fail to account for important factors such as:
Interior condition
Quality of upgrades
Floor plan functionality
Views
Deferred maintenance
Lot usability
Location within a neighborhood
Two homes with identical square footage may differ in value by hundreds of thousands of dollars.
Online estimates simply cannot evaluate every factor that influences market value.
How Real Estate Professionals Determine Market Value
The most reliable way to estimate value is by analyzing recent comparable sales.
These are homes that are similar in:
Size
Age
Condition
Location
Lot characteristics
Amenities
A professional market analysis also considers:
Pending sales
Active competition
Market trends
Buyer demand
Seasonal influences
This process provides a much clearer picture of value than relying solely on the asking price.
The Belmont Example
Suppose two nearly identical homes are listed in Belmont.
Home A is listed at $1,995,000.
Home B is listed at $2,295,000.
Most buyers assume Home B is worth more.
However, after reviewing recent comparable sales, both homes may have a market value closer to $2,200,000.
One seller chose an aggressive pricing strategy designed to attract multiple offers.
The other seller chose a higher list price hoping to negotiate downward.
Different asking prices.
Similar market value.
The Most Important Number Isn’t the Asking Price
When evaluating a home, buyers often focus on the list price.
Experienced buyers focus on value.
The real questions are:
What have similar homes recently sold for?
How does this property compare?
What are buyers currently willing to pay?
How competitive is the market?
Answering those questions will tell you far more about value than the asking price alone.
How We Help Buyers Determine Value
One of our most important responsibilities is helping buyers understand what a property is actually worth before they write an offer.
We analyze comparable sales, market trends, inventory levels, buyer demand, and the unique characteristics of each property to help our clients make informed decisions. We’re constantly viewing homes before they sell to make ourselves acutely aware of what the market value should be, not necessarily what it will be.
The goal isn’t simply to win the home.
The goal is to help you make a good decision.
Because understanding market value is one of the best ways to buy with confidence and avoid costly mistakes.
Understanding what a home is truly worth is one of the most important services we provide. As the Broker of Record for MORGANHOMES, Inc., Drew has extensive training in property valuation and market analysis beyond that required of a typical real estate salesperson. Combined with Christine’s experience as a former appraiser, our clients benefit from a unique depth of expertise when determining a home’s value, developing pricing strategies, and making informed real estate decisions.
Drew and Christine Morgan are experienced REALTORS and NOTARY PUBLIC located in Belmont, CA, where they own and operate MORGANHOMES, Inc. They have assisted buyers and sellers in their community for over 30 years. Drew and Christine have received the coveted Diamond award, ranking among the top 50 agents nationwide and the top 3 in Northern California by RE/MAX. To contact them, please call (650) 508.1441 or emailinfo@morganhomes.com.
For all you need to know about Belmont, subscribe to this blog right here. You can also follow us on Facebook and on X.
This article provides educational information and is intended for informational purposes only. It should not be considered real estate, tax, insurance, or legal advice; it cannot replace advice tailored to your situation. It’s always best to seek guidance from a professional familiar with your scenario.
How much money do you really need to buy a home in Belmont? Using the current median home price of $2.2 million, we break down common down payment options, closing costs, and total cash needed so buyers can plan with confidence.
Many buyers focus only on the mortgage payment, but the true cost of homeownership includes much more. Learn how PITI, property taxes, insurance, HOA fees, maintenance, and impounds affect your monthly housing costs.
Many home buyers don’t realize there’s a significant legal difference between being a client and being a customer. Understanding agency representation and fiduciary duties can help protect your interests when purchasing a home.
Congratulations—your offer has been accepted! But what happens next? Learn how escrow works and follow the step-by-step process from depositing your earnest money deposit through receiving the keys to your new home.
With today’s online listing sites and social media, homeowners have access to more information than ever before. Yet despite all that information, many sellers still leave money on the table—not because they don’t care, but because they don’t know what they don’t know.
After more than 30 years of helping Peninsula homeowners buy and sell real estate, we’ve found that most costly mistakes fall into five categories.
Many sellers assume buyers will overlook deferred maintenance, dated finishes, or needed repairs.
They won’t.
Buyers often overestimate the cost of repairs and discount their offers accordingly. In many cases, a modest investment in preparation can produce a far greater return when the home sells.
That’s why one of our first priorities is helping sellers determine which improvements are worth making—and which aren’t.
Buyers decide how they feel about a home within moments of walking through the front door.
Clutter, personal décor, poor lighting, and worn finishes can distract buyers from seeing the home’s true potential.
Professional staging, thoughtful preparation, and strategic presentation help buyers emotionally connect with a property, which often translates into stronger offers.
Price a home too high, and buyers may never seriously consider it. Price it too low, and you risk leaving money on the table.
The goal isn’t simply to attract attention. It’s to position the property to generate maximum interest and competition among qualified buyers.
Successful pricing requires more than looking at online estimates. It requires understanding buyer behavior, market conditions, and the subtle factors that influence value.
Real estate transactions are often far more complex than they appear.
Negotiations, inspections, disclosures, title issues, financing, contracts, and risk management all require experience and judgment. That’s why choosing the right advisor matters.
As a California Broker, we’ve completed significantly more education, training, and experience requirements than are required for a salesperson license. More importantly, we’ve spent decades helping clients navigate the real-world challenges that arise during a transaction.
Our role isn’t simply to market your home.
It’s to protect your interests, identify potential problems before they become expensive ones, and help you make informed decisions every step of the way.
It’s about preparing the property properly, pricing it strategically, negotiating effectively, and managing risk throughout the process.
That’s where experience matters.
Our mission has always been simple:
Helping People Make Good Decisions℠
And when it comes to selling one of your most valuable assets, good decisions can make all the difference.
NOTE: If you want the full list of the Best Questions Every Seller Should Ask But Don’t, simply email us at: BestQuestions@morganhomes.com
Drew and Christine Morgan are experienced REALTORS and NOTARY PUBLIC located in Belmont, CA, where they own and operate MORGANHOMES, Inc. They have assisted buyers and sellers in their community for over 30 years. Drew and Christine have received the coveted Diamond award, ranking among the top 50 agents nationwide and the top 3 in Northern California by RE/MAX. To contact them, please call (650) 508.1441 or emailinfo@morganhomes.com.
For all you need to know about Belmont, subscribe to this blog right here. You can also follow us on Facebook and on X.
This article provides educational information and is intended for informational purposes only. It should not be considered real estate, tax, insurance, or legal advice; it cannot replace advice tailored to your situation. It’s always best to seek guidance from a professional familiar with your scenario.
Buying a home is one of the largest financial decisions you’ll ever make. Discover five practical strategies that can help you make smarter decisions, avoid common pitfalls, and navigate the home-buying process with confidence.
At what point does a residence stop being a home and become a headquarters? The Grand Penthouse at Fremont street sits 800 feet above San Francisco, combining world-class luxury, engineering excellence, and a front-row seat to the next generation of innovation.
In Belmont real estate, not all square footage is created equal.
Many homeowners have heard the term “FAT” mentioned in conversations about hillside development, additions, or vacant land — but few fully understand what it means or how it can affect property value and future building potential.
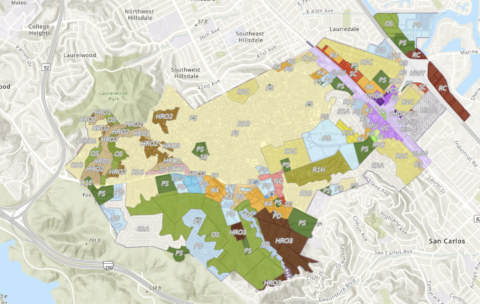
In Belmont, “FAT” stands for Floor Area Transfer — a unique zoning tool primarily associated with certain Hillside Residential and Open Space zoning districts, commonly referred to as HRO zones. The program was designed to help balance hillside preservation with reasonable residential development opportunities. Try this link to see Belmont’s interactive zoning map.
For some property owners, FAT can create valuable development opportunities. For others, it may permanently limit future expansion rights. Understanding how it works is important whether you are remodeling, purchasing vacant land, or simply evaluating your home’s long-term potential.
What Is a Floor Area Transfer?
In simple terms, Belmont’s FAT program allows allowable building square footage to be transferred from one property to another under certain conditions.
Some hillside lots in Belmont are steep, difficult to access, environmentally sensitive, or otherwise poorly suited for development. Other nearby lots may be more practical building sites.
The FAT system was created to preserve open space and hillside character, reduce excessive grading and environmental impact, concentrate development in more suitable areas, and provide flexibility for certain homeowners.
Where Does FAT Apply?
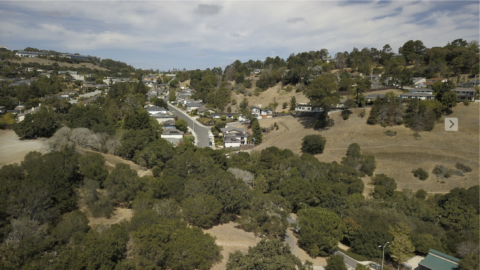
Floor Area Transfers are most commonly associated with Belmont’s Hillside Residential and Open Space zoning districts, particularly HRO-2 areas in locations such as portions of the San Juan Canyon and Western Hills neighborhoods. Here’s a link to Belmont’s interactive zoning map,
These areas often involve steep slopes, geological considerations, limited road access, tree preservation requirements, environmental review, and complex grading constraints.
Why FAT Can Benefit Some Homeowners
For certain properties, FAT can create meaningful value.
A homeowner who wishes to expand beyond the normally permitted floor area may potentially obtain additional square footage through a transfer arrangement, subject to City approval and zoning requirements.
Potential benefits may include larger homes in areas with restrictive base limits, greater flexibility for additions or remodels, improved long-term resale appeal, and enhanced usability of otherwise constrained parcels.
Why Some Vacant Lots Sell for Surprisingly Low Prices
One common source of confusion involves vacant hillside parcels advertised online at prices far below typical Belmont land values.
Buyers sometimes assume these lots are bargains when, in reality, many come with substantial development limitations. Some may require additional Floor Area Transfers, extensive engineering, or may already have transferred away their development rights.
Important Considerations Before Buying or Remodeling
Because FAT regulations can involve zoning interpretation, planning approvals, recorded easements, geological review, and design review requirements, homeowners should consult directly with the City of Belmont Planning Department and qualified professionals before making assumptions about development potential.
In Belmont Hillside development, details matter.
The Bigger Picture
Belmont’s FAT program reflects the broader balancing act that defines much of Peninsula real estate: how cities preserve neighborhood character and environmental sensitivity while still allowing homeowners reasonable flexibility and property rights.
Whether one agrees with every aspect of the system or not, Belmont’s approach has helped preserve significant portions of the city’s hillside character while allowing selective development opportunities in appropriate locations.
Final Thoughts
Real estate value is not determined by square footage alone.
In Belmont, zoning, usability, topography, and development potential can dramatically affect a property’s long-term value and possibilities.
At MorganHomes, we believe informed homeowners make better long-term real estate decisions.
And in a city as nuanced as Belmont, local knowledge matters.
Thank for reading along.
Drew and Christine Morgan are experienced REALTORS and NOTARY PUBLIC located in Belmont, CA, where they own and operate MORGANHOMES, Inc. They have assisted buyers and sellers in their community for over 30 years. Drew and Christine have received the coveted Diamond award, ranking among the top 50 agents nationwide and the top 3 in Northern California by RE/MAX. To contact them, please call (650) 508.1441 or emailinfo@morganhomes.com.
For all you need to know about Belmont, subscribe to this blog right here. You can also follow us on Facebook and on X.
This article provides educational information and is intended for informational purposes only. It should not be considered real estate, tax, insurance, or legal advice; it cannot replace advice tailored to your situation. It’s always best to seek guidance from a professional familiar with your scenario.