Why Waiting Out the Market May be a Fool’s Game

Should you buy a home now, or wait?

Let’s face it; nobody wants to purchase a home at the peak of the market. And most buyers would love to imagine they got a good deal. But with today’s local market conditions, that’s a tall order to fill.

The internet has changed the way buyers search for homes. Gone are the days of buyers waiting for their REALTOR to call each week with the latest new listings. Today, buyers have more-or-less unfettered access to the Multiple Listing Service where agents cooperate by sharing their inventory of homes for sale.

There is a small selection of “off-market” or “Pocket Listings” which we discussed in an earlier article. How do you find these? For that, you still need a REALTOR.

The larger question is should you purchase a home today, or wait for more inventory or prices to decline?

This graph for San Mateo County illustrates that as of June 2013 we are still not back to historic high home values—though in select neighborhoods on the Peninsula we just recently surpassed previous historic highs.


San Mateo Home Values

Today’s buyers are snapping up homes with a frenzied sense of urgency—and they’re paying top dollar to do so. Why?  Because interest rates are still very favorable and increase a buyer’s ability to pay over the seller’s asking price—but the trend is about to change and probably for good. We predict that in Q2 of 2014 mortgage interest rates will probably be a full point higher than they are today. And that’s not pure conjecture; the Federal Reserve has not only signaled they have overtly stated that when unemployment reaches  6.5% it will begin raising the federal funds rate—and they have already begun easing up on purchasing bonds to artificially keep rates low. In this article we discussed how much more one would pay interest over the life of a  home loan when rates return to normal levels–and the numbers are staggering.

If the entire country’s housing market was rebounding at the same rate of homes on the Peninsula, one can easily see that the Fed would have already reacted and raised rates.

Buyers are locking in lower than historical trend rates and in most cases paying well over what a seller is asking for a home because money is cheap.

Should I wait for More Favorable Conditions?

Have you been lulled into thinking these historic low rates will continue? Then take a moment to read this eye opening post we did back in March. Trying to save more money for a down payment at this point may be futile as home prices are escalating at a rate that the average buyer could never keep up with in monthly savings. Once interest rates begin to rise to normal historical levels, any perceived savings—even if the market cools off—will be quickly negated in interest higher payments.

We’ve been in business for over 20 years selling home on the Peninsula and we’ve experienced several recessions so the trends and cycles are obvious to us. Timing them is more difficult, but from everything we have seen, we believe it would be better in today’s environment to jump in and get a home today, rather than bet on more favorable conditions in the near future. If you are still sitting in the sidelines, you are betting against the odds—that unprecedented low interest rates will continue, and that home prices have already hit their peak and will soon decline. Barring any unforeseen catastrophe, that’s not a bet we would take right now.


Drew & Christine Morgan are REALTORS/NOTARY PUBLIC in Belmont, CA. with more than 20 years experience in helping sellers and buyers in their community. They may be reached at (650) 508.1441.

The information contained in this article is educational and intended for informational purposes only. It does not constitute real estate, tax or legal advice, nor does it substitute for advice specific to your situation. Always consult an appropriate professional familiar with your scenario.

Belmont Home Values Break New Records – Home Sales Report for May 2013

It’s time to do the numbers, and I can hear the jingle playing in my head “We’re in the Money”–a little ditty from NPR’s Market Report segment which they play when the stock market is up. As each month goes by it seems Belmont home values keep setting new high water marks–not that we’re insensitive to the woes of buyers. We represent Buyers too and we know how frustrating it can be to secure a home in today’s market. The inherent problem for buyers when timing the market is that when housing prices are down, typically so is the overall economy and nobody feels much like taking on an enormous mortgage when coworkers are being laid off and empty cubicles are selling for pennies on the dollar on Craig’s list. Finally, when the economy picks up and everyone feels happy again they all starts to buy at the same time and drive up prices with overbidding. Add to that the sense of interest rate lock urgency and you have a market running full speed ahead. It’s no longer how much a home will sell for, it’s how far over asking will it go.

Belmont Home Values
Can You Save Fast Enough?

This month just about every positive indicator for sellers was up. In fact they were all up except the days on the market [DOM] or the time it took a seller to sell their home—that statistic was down which really means it was up for sellers—another positive sign.

So let’s begin by dispensing with any question of where the market is today—it’s clearly rebounding and doing so at a pace like we’ve never seen—and we’ve seen a lot of ups and down in our 20+ years of selling homes.

What’s driving this rebound at a clearly unsustainable level? Ironically, the good news may be is it’s a temporary influx which may soon be abating. The days of government intervention in the market by keeping interest rates artificially low with bond purchases may be numbered—at least that’s what Wall Street thinks. When we wrote this the stock market was singing “Stormy Weather” as news of an impending slow down in bond purchases sent the stock market into a bit of a humble tumble.

Looking at Belmont home sales for May 2013, we see that there’s no more debate about how the market is doing. The only question is, how long will this corybantic pace continue?

Belmont Home Values
Click on the picture for a larger size.

SALES

Home sales, after being down past month, rebounded with a 23% increase over May of 2013 were 32 homes traded hands as compared to 26 last May. The last time Belmont had that many homes sell in one month was in August of 2005 when 35 homes sold—well before the market correction which began in April of 2006 [it took well into another year for the national housing dilemma to begin to affect Belmont’s more insulated economy].

MEDIAN PRICE

Belmont home values reflected the median price topping out at $1,100,000 this May which has only been eclipsed twice in the history of Belmont home values—once in 2007, and most recently in January this year. One cannot not escape noticing that the median home price in Belmont has been over a million dollars four out of the last five months—a pinnacle in Belmont’s housing values trends as never before have we seen a sustained median home price over the million dollar mark.

So did larger homes sell this year? Each month we’re sure to look and see if that’s the cause and each month the answer has been yes, but only nominally. Certainly not enough to account for the year over year gains.

The median size home which sold in May of 2012 was 1,790 square feet. This May that increased 6.4% to 1,905 while the median home price increased 33%–from $825,000 last May to $1,100,000 in 2013.

What does this all mean? It means that a home 6.4% larger cost you 33% more this year. It means that Belmont home values are rising faster than most buyers can save money.

DOM [Days on the Market]

Statistically speaking, if you are going to get more for your home than you are asking, in Belmont that means you’ll be on the market less than 14 days. Between 14 and 21 you are considered lucky to get your asking price and rarely does a seller get their asking price after 21 days on the market.

This month’s numbers bear that out in spades as all of the homes which received more than their asking price did so in only 13 days. No home sold right at the seller’s asking price but of the few homes which were overpriced, they languished on the market for on average 22 days and received 98% of their initial asking price as compared to everyone else who netted on average 110%. Can you imagine being one of the few sellers who received 12% less for their home than everyone else? Clearly not all agents are created equal.

Of course getting too much for a home is usually the result of the same root cause—an agent who has no idea how to price a home—just that in the latter case the seller is much happier and probably never the wiser.

We’ll leave you with this one watercooler statistic. Did you know that in May the average Belmont home sold for $100,000 more than the asking price!

Drew & Christine Morgan are REALTORS/NOTARY PUBLIC in Belmont, CA with more than 20 years of experience. They may be reached at (650) 508.1441 or info@morganhomes.com

Disclaimer:

The information contained in this article is educational and intended for informational purposes only. It does not constitute real estate, tax or legal advice, nor does it substitute for advice specific to your situation. Always consult an appropriate professional familiar with your scenario.

Drew & Christine Morgan did not necessarily participate in these sales.

Are Home Prices Rising Too Fast?

Are Home Prices Rising Too Fast? [re-blog]

DAILY REAL ESTATE NEWS | MONDAY, APRIL 15, 2013Rising Home Prices

Some housing analysts are concerned that the sudden rise in home prices could make homes more unaffordable again if the price increases outpace income growth, The Wall Street Journal reports.

Average housing costs for home buyers who took out a mortgage were around 22.5 percent of average incomes, according to John Burns Real Estate Consulting. That is down from 38.5 percent in 2006, the peak of the housing bubble. The historical average is about 33 percent.

But with home prices rising in many markets and, in some, rising at a faster pace than income levels, will more people soon be priced out of the market?

Housing analysts say that, for now at least, lower mortgage rates are offsetting the higher prices of homes.

Borrowers have seen their purchasing power rise by around 33 percent over the past four years due to the low interest rates, The Wall Street Journal reports. For example, a borrower can make a $1,000 monthly mortgage payment and qualify for a $222,000 mortgage at today’s low interest rates, compared to 2008 when they’d likely qualify for $165,000 when mortgage rates were around 6.1 percent — nearly double what they are today.

Borrowers are able to withstand home-price increases because of the low rates, not because household incomes are growing, The Wall Street Journal reports. If mortgage rates tick back up to the 6 percent or 8 percent range, homes may look overpriced relative to incomes, according to housing analysts.

Source: “Why Rising Interest Rates Could Eventually Curb Price Gains,” The Wall Street Journal (April 10, 2013)

Read More

Existing Home Sales and Prices Continue to Rise
What’s Really Driving the Rise in Home Prices?

Interest Rates Predicted to be 10% by Year’s End

That could easily have been a headline ripped from the pages in major newspapers back in August of 1994 when rates were only 6%–yet by year’s end the prediction nearly came true as a mere four months later they would rise to almost 10%!

Are you old enough to remember what normal mortgage interest rates were like?

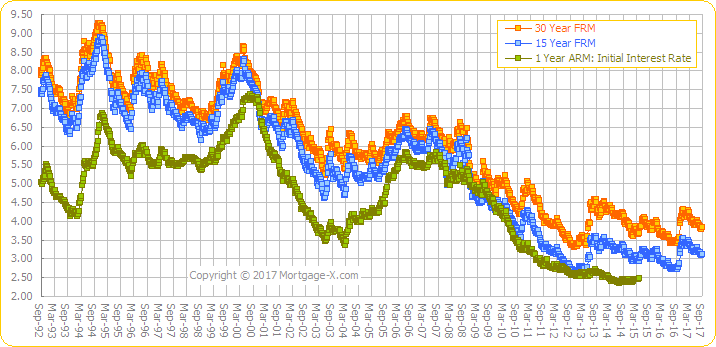
Interest Rates DropAccording to Bankrate.com, mortgage interest rates have been attractive for such a long stretch of time that many homebuyers and homeowners might not realize that rates haven’t always been this low. Mortgage interest rates in the 4-percent range were unheard of until 2010, and rates in the 5-percent range were unknown prior to 2003, according to Bankrate.com surveys through the years and a chart of monthly average mortgage interest rates tracked by the Federal Reserve since 1971.

Prior to 2003, higher mortgage interest rates were the norm. In the early 1970s, rates hovered in the 7-percent range and spiked up above 9 percent in late 1975, late 1976 and most of 1978. At the end of the decade and throughout the 1980s, mortgage interest rates rarely dipped lower than 10 percent.

In the early 1980s, mortgage interest rates brushed the stratospheric highs of 18 percent and even 19 percent. Imagine trying to get a home loan with an interest rate of 18 percent. At that rate, the mortgage interest deduction would be a very lucrative income tax perk, but the monthly payment on a loan would be far more painful than a typicalmortgage payment today.

During the 1990s, mortgage interest rates ranged from around 7 percent to roughly 9 percent for many years. It was only in 2000 that rates began to fall to earth. They held at less than 9 percent in 2000, less than 8 percent in 2001 and less than 7 percent in 2003.


Reproduced with the permission of Mortgage-X.com

If you’ve been putting off refinancing your home or buying a new one, don’t get lulled into inaction with the thought that these new low rates are here to stay.

The information
contained in this article is educational and intended for informational
purposes only. It does not constitute real estate, tax or legal advice, nor
does it substitute for advice specific to your situation. Always consult an
appropriate professional familiar with your scenario.


Drew & Christine
Morgan did not necessarily participate in these sales.

DRE License Numbers
01124318 & 01174047

Drew & Christine
Morgan, REALTORS | Notary Public


Saving More For A Down Payment–is it Wise?

Is it Wise to Save More For Your Down Payment?

Are you a first-time buyer wondering how you’ll ever have
enough of a down payment to buy your first home?

Do you wonder how much down payment you need for a home? Did
you know that if you’re buying a home and using FHA financing your down payment
could be as little as 3.5?. Ten percent down loans are also making a comeback
and are quite common once again.

But should you wait and save more for your down payment so
you can be 20% down? In our current market, that might not be such a great
idea.

Home values have been increasing rapidly in the last year.
An area in Belmont known as Sterling Downs offers many first time buyers
affordable living options. But the values there have been rising with the rest
of the tide.

This graph illustrates the price trend in the last year in
Sterling Downs, Belmont. We used homes which closed escrow since January of
last year that were three bedrooms and between 900 and 1,100 square feet so
that the sale prices weren’t affected by the size of homes selling.

Clearly it would be near impossible to keep up with the increase
in the selling prices simply by saving more money each month from your paycheck. We estimate
that in 2012 to date the average Sterling Downs home increased $75,000 or just over
$5,000 per month.

If you have been waiting to buy a home and need some advice
on some of the varying financing options which are available, feel free to contact us and
we’ll refer you to one of the great mortgage brokers who can answer all of your
questions.


Mortgage-rates27-300x300
The information
contained in this article is educational and intended for informational
purposes only. It does not constitute real estate, tax or legal advice, nor
does it substitute for advice specific to your situation. Always consult an
appropriate professional familiar with your scenario.


DRE License Numbers
01124318 & 01174047

Drew & Christine
Morgan, REALTORS | Notary Public

All data was retrieved
from MLS Listings, Inc. The Multiple Listing Service for San Mateo County.


Belmont Median Home Price Hits Record High

What’s up with this crazy market? The stock market hit an
all time high this week and our local housing prices are right in step. Pundits
say that our housing market tracks the S&P 500 and if they’re right, we’re
in for a heck of a ride.

Belmont housing prices continued to show gains into February
as Belmont had both month-to-month and year-over-year increases in the median
price—so let’s start there.

This graph shows the median price trend for the past year in
Belmont.


February 2013 for Belmont

[click on the image for a larger graph]

MEDIAN PRICE

The median home price in Belmont increased 42% last month
over a year ago. Belmont’s February home price reached $1,108,000. To put that
in perspective that is the second highest median home price for Belmont since we began tracking the market in 1998. The only other time it was this high was in
October of 2007—right before the housing crash hit the Peninsula.

If you’ve been following our market
update you know we never leave the raw numbers alone. Since Belmont has a relatively
small number of homes selling each month when a disproportionate number of
smaller or larger homes sell in a given month it impacts the median home price and
skews it off axis.

In order to adjust for this we look at the size of homes
selling in the two periods. Insofar as we know we are the only local experts
drilling down to this level of detailed analysis.

Homes which sold in February 2103 in Belmont were 20% larger
than they were in 2012 during the same period, so while the median increase in
price was 42%, could this mean the adjusted median home price gain was actually
closer to 22%?

Looking at it another way, the difference in the size of homes
selling in the two periods was 1,970 square feet in 2013 and 1640 square feet
in 2012—a difference of 330 square feet (20% increase this year). Now let’s
multiple that by the median price per square foot the homes sold for in 2012
and we get $181,500. If we add that to the median price in 2012 our adjusted
median home price for last year would be  $961,500—meaning that using this method for
adjusting the median home price we get a 15% increase year over year; and the
reality probably lies somewhere in between. Any way you slice it, 15-20% increase
year-over-year is an amazing rebound and this increase will hopefully create
more “equity sellers” and more seller’s with equity means more sellers who can sell which will in turn increase the housing supply.

One of the most impressive statistics is that only two homes had any price reduction at all and just as few sold for less than the seller’s asking price.

SALES

Sales were down this year over last so we checked the
inventory levels to try and understand why. In January of 2012 there were 21
new listings which hit the market. Adding to an already bloated inventory that
caused the inventory level last year in February to soar to 41 homes available
for sale. Contrasting that to this year when the new listings dropped 50% to
only 14 and our inventory of homes for sale stood at a paltry 12!

PERCENT OF ASKING

In February of 2012, seven of the 19 sales, or 37%, were for
more than the seller’s asking price by on average $46,000. This February 73% of
the sellers received on average $106,000 over their asking price.

For those sellers who were less fortunate, in 2012 53% sold their
home for on average $29,000 less while in 2013 only 18% had to sell for on
average $35,000 less.

The percent the sellers received of asking were 97.3% in
2012 as compared to 107.7 in 2013.

If you are considering selling your home the above statistics
might lead you to believe that it’s back to the old days when any agent could
put a sign out front and sell your home. And while that may be true—that your
home might sell—the percentage you actually receive of your asking price varies
relative to the degree of expertise in agent’s marketing plans and advice. If
you want to be statistically guaranteed that you’ll get the best results,
contact us for a consultation. Our record for selling every home we’ve listed,
for more money, and in the shortest period of time is unmatched—of the top
Belmont REALTORS, nobody has us beat.

If you are looking for someone to help you sell your home, we’re someone you should know.

The information contained in this article is educational and intended for informational purposes only. It does not constitute real estate, tax or legal advice, nor does it substitute for advice specific to your situation. Always consult an appropriate professional familiar with your scenario.

Drew & Christine Morgan did not necessarily participate in these sales.

DRE License Numbers 01124318 & 01174047

Drew & Christine Morgan, REALTORS | Notary Public

*All data was retrieved from MLS Listings, Inc. The Multiple Listing Service for San Mateo County.


Greek Festival in Belmont 2012 – Free Tickets Just For The Asking!

Find the meaning of kefi (joy) in this three-day true Greek extravaganza. The Belmont Greek Festivalwill feature delicious Greek meals and desserts, nonstop music and dancing, exciting exhibition folk dancing, choral folk singing, a captivating mythology play, a fun children’s amusement area, and children’s entertainer Andy Z.

Continue reading

My Story. A Story About A Home in San Carlos

I visited a home in San Carlos today and the seller had this story posted for everyone to read. I found it moving…

My Story

Although I was “born” in 1969, my story really began 13 years before. One spring day, a young couple looking for the perfect spot to raise a family, came down the lane. They had seen many, many properties but the woman knew the minute she spotted the majestic oak that this was THE ONE.My Story in San Carlos

Don’t you want to see the house first asked the man, referring to the little, two-bedroom house that was, at the time, the only one on the property.

“Yes”, replied the woman as she plopped down under the oak, “But it won’t matter. I already know this is our home.”

And so it was. Soon they welcomed their first child, then another, and so on. The little house was bursting at the seams. But there was room to grow- underneath the grand oak tree. I swelled with pride when my family moved in. the eldest, on the verge of becoming a young woman, loved her private balcony and hiding away in the library that held shelf-after-shelf of her favorite books. The little red-headed boy chose the largest room because it looked out onto the huge yard he loved to explore, particularly his favorite plum trees that he knew would provide years of climbing and juicy plums ideal for neighborhood battles. The littlest, a brown-haired girl, was tucked away in the smallest bedroom, bedecked with a brand-new canopy bed that made her feel cozy and provided the perfect cave for her collection of much loved stuffed animals.

So, our life together began. As the years went on, I was filled to the brim with love, laughter, song, tears, and heartache –all the joys and sorrows that life brings. I embraced my family and loved watching them grow and change. But, one by one, the children began to leave. I was sad, but I knew that no matter what house the moved to, I was always Home. I was the place that held the Christmas tree; I was the kitchen that cooked Thanksgiving turkey; I was the pool that hosted birthday parties. But as time passed, their visits were less often, the couple stayed with me, but it became clear the others had, at last, found their own perfect homes in which to build new memories.

And one day the couple looked at each other across their now – empty table. Their bodies were bent and their faces weathered. They new, and so did I

“It’s time.”

Time to pass me on to another family, to build their own lifetime of memories, underneath the branches of my sheltering oak tree.