Which Pays More? Comparing San Francisco MSA and San Mateo–Redwood City Housing Returns

SFMSA va MSAD

Bay Area Housing Showdown: San Francisco Metro vs. the Peninsula

Until recently, the famous Case-Shiller housing reports lumped the entire Bay Area into the San Francisco MSA—covering Alameda, San Francisco, Marin, San Mateo, and Contra Costa. That broad view smoothed out some of the ups and downs, but it also mixed fast-growing markets with slower ones.

As the population pushed past 2.5 million, analysts carved out a new sub-market: the San Mateo–Redwood City Division, which focuses more on the Peninsula. While this still includes some underperformers (like Daly City and South San Francisco), it’s a welcome step toward highlighting mid-Peninsula dynamics.

So how do the two compare?
If you had invested in 1990, the San Francisco MSA would have returned about 8% more than the Peninsula division. But here’s the twist—those extra gains came with more volatility. The Peninsula, while slightly behind in raw returns, offered a smoother ride.

Growth Since 1990

  • San Francisco MSA (metro-wide)
    • Total Growth: +381%
    • CAGR: ~4.6% annually
  • San Mateo–Redwood City Division
    • Total Growth: +344%
    • CAGR: ~4.3% annually

🔑 Insight: The metro-wide San Francisco market slightly outperformed the Peninsula Division in both cumulative growth and annualized return.
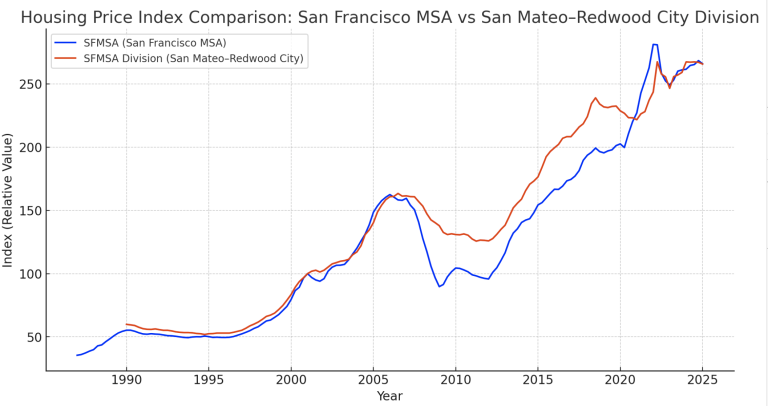
SFMSA vs MSAD

📊 Volatility & Cycles

  • San Francisco MSA
    • Bigger swings during the dot-com bust (2000–2002) and 2008 housing crash.
    • More dramatic rebounds in the tech booms (2012–2022).
    • Essentially more “leveraged to tech cycles.”
  • San Mateo–Redwood City Division
    • Tracks very closely but with slightly milder peaks and troughs.
    • The Peninsula benefits from strong fundamentals (jobs, income, schools) but didn’t surge quite as aggressively in the big runups.

🏆 Which is the Better Investment?

  • San Francisco MSA (metro-wide):
    Better for maximum long-term appreciation, but you need tolerance for volatility.
  • San Mateo–Redwood City Division:
    Slightly lower growth, but steadier and less extreme in downturns. Likely better if you prioritize stability and resilience over maximum upside.

👉 In short:

  • Metro (SFMSA) = higher growth, higher volatility.
  • Peninsula (Division) = steadier, still strong, but slightly less aggressive growth.

Here’s the investment scenario analysis (1990  2025) for a $500,000 purchase in each market:

  • San Francisco MSA (metro-wide):
    $500,000 
     ~$2.40 million
  • San Mateo–Redwood City Division (Peninsula):
    $500,000 
     ~$2.22 million

📊 Our Interpretation

  • Both markets delivered excellent long-term gains.
  • The metro-wide San Francisco market outperformed by about $186,000 over 35 years.
  • The Peninsula provided nearly the same wealth-building power but with slightly smoother cycles.

👉 In other words, investing in the SF metro as a whole yielded ~8% more wealth by 2025, but the Peninsula may have offered a calmer ride with fewer sharp downturns.

* Note that The MSAD is also a part of the larger MSA data−So in effect the Peninsula market helped the numbers in the San Francisco MSA market.

Drew and Christine Morgan are experienced REALTORS and NOTARY PUBLIC located in Belmont, CA, where they own and operate MORGANHOMES, Inc. They have assisted buyers and sellers in their community for over 30 years. Drew and Christine have received the coveted Diamond award and ranked among the top 50 agents nationwide and the top 3 in Northern California by RE/MAX. To contact them, please call (650) 508.1441 or emailinfo@morganhomes.com.

For all you need to know about Belmont, subscribe to this blog right here. You can also follow us on Facebook and on Twitter.

This article provides educational information and is intended for informational purposes only. It should not be considered real estate, tax, insurance, or legal advice; it cannot replace advice tailored to your situation. It’s always best to seek guidance from a professional familiar with your scenario.

BROKER | MANAGER | NOTARY

Maximizing Your Real Estate Investment: Unlocking $1.5 Million in Untaxed Gain

If you’ve been residing in your Bay Area home for over five years, chances are you’ve already surpassed the $500,000 capital gains abatement threshold.

Continue reading

Navigating Bay Area Real Estate: Balancing Wealth Optimization and Limited Data Amidst Shifting Market Dynamics

Given the substantial wealth associated with owning property in the Bay Area, it’s rational for sellers to strive for enhanced investment gains and carefully assess the most opportune moment to sell their residences. However, the challenge lies in the limited data available to assist them in reaching a well-founded decision. 

Our objective is to adopt a forward-looking futurist strategy to aid individuals in making well-informed decisions while avoiding any reliance on methods like fortune-telling cards or crystal balls, or theories that stand to benefit us personally.

The stability of our real estate values has been influenced by Sellers’ reduced desire to sell their homes, a direct consequence of rising interest rates. This has maintained a state of relative equilibrium in the market compared to recent times.

However, the situation might shift in 2024. More Sellers have postponed selling their properties this year, hoping for a more favorable market next year. This presents a potential issue. 

Historical market downturns, like the one in 2007, have seen buyers holding off on purchases for years. When they eventually rejoin the market, they tend to do so simultaneously due to changing conditions that they have in common, resulting in multiple offers and price escalation—a phenomenon observed in 2012 following a housing hiatus.

Sellers could also face this challenge. Previously, when government bond purchases kept interest rates artificially low, and people refinanced at around 3%, the anticipation was that rates would rise when the bond purchases ceased. As predicted, Sellers have now refrained from refinancing and moving due to the prospect of significantly increased mortgage payments.

Given that interest rates have doubled in the past two years, Sellers lack motivation to upsize their homes, considering their mortgage payments would more than double. Property tax hikes further compound this issue. Many Sellers we’ve communicated with plan to wait until 2024 before acting.

In this scenario, if more homes come onto the market while the buyer pool remains static, it could lead to lower home prices in 2024 due to reduced competition for available homes.

Another challenge in 2024 is the presidential election year, which is historically associated with market pullbacks due to political and economic uncertainties. These uncertainties breed caution and indecision among buyers, particularly from May to November, resulting in further downward pressure on prices.

This graph illustrates the effect the highly contentious election between Hillary Clinton and Donald Trump in 2016 had on home values during those months.

Presidential Election Year Impact on San Mateo County Home Values—2016

Drawing from historical market trends, we recommend Sellers take proactive measures to address the potential influx of 2023’s home Sellers. Selling before May 2024 becomes crucial for maximizing returns ahead of the election year’s uncertain market conditions.

Drew & Christine Morgan are REALTORS/NOTARY PUBLIC in Belmont, CA with more than 30 years of experience in helping sellers and buyers in their community. As Diamond recipients, Drew and Christine ranked in the top 50 RE/MAX agents nationwide and the top 3 in Northern California.  They may be reached at (650) 508.1441 or emailed at info@morganhomes.com.

For all you need to know about Belmont, subscribe to this blog right here. You can also follow us on Facebook and on Twitter.

The information contained in this article is educational and intended for informational purposes only. It does not constitute real estate, tax, insurance or legal advice, nor does it substitute for advice specific to your situation. Always consult an appropriate professional familiar with your scenario.

Drew Morgan, Broker Associate 01124318 | Christine Morgan, Sales Associate—Owners of MorganHomes, Inc. Licensed under RE/MAX Star Properties, 01811140

The end of the MLS as we know it

Search_bar_3

Launching the latest and greatest real estate search engine seems to be the new dot com venture. It feels like every time I turn around Inman News is sending me a list of newly launched search engines targeted at the eyes of would-be home shoppers. The latest email alert on August 8th was an article titled, “20 Online Real Estate Sites You Don’t Know About… But Should”.

That’s great I thought. Add that to the 1000+ other real estate search engines and you realize that all this information is a giant step backward—not forward.

Consumers want to be able to do their own legwork—like when I’m looking for a car. I peruse all of the available models on-line, run a compare search, limit it to a few possibilities then go visit the showroom. People looking for a home want the same information and once their interest is piqued, they want to see some homes in person.

One good search engine could do that just fine; one that has all of the available homes for sale in the area they’re searching, offers interactive mapping (with aerial views), and while we’re at it a comparison page, a place to save your viewed properties, and just to add more value a list of homes that recently sold nearby.

Our local Multiple Listing Service offers only a few of these features. It does provide for the most current and accurate information on listings listed by local cooperating brokers. And albeit a small fraction of the inventory, what it lacks is for-sale by owner properties. It also lacks many of the trick features these mashed-up web pages offer like property comparisons and a personal profile to store past searches.

What the MLS’s need to do is step-up to the plate and provide more information to the consumer. No consumer wants to search ten different web pages to get the entire inventory and most consumers don’t need a national database of homes for sale. Typically, buyers have narrowed down their search radius to a few miles and boasting of a national database of homes for sale seems more about bragging rights than valuable information.

Will any of these search engines put Joe real estate agent out of business? They had better hope they don’t. Because what they are offering is essentially a data feed and interface—and without real estate agents actually in-putting data into the MLS—which is in turn fed into the secondary web search market—there would be little inventory to view.

Imagine every seller uploading their own data. First, they’d have to make sure they hit all 1000+ search engines since there would be no centralized database to draw from. Second, who would police this data for accuracy, timeliness and authenticity? What about confidential information—how would that be handled? When a home is vacant should the seller input “we’re going on vacation so show our home anytime” on the internet? What type of lock boxes would a seller use and if so would they put the combination on the internet along with their home phone number for showings?

Don’t get me wrong. I love web sites like Zillow who offer fun interactive tools that make home buying more interesting. Let’s face it they have cool maps and fun algorithms and I enjoy looking at them to see the values they come up with. But they aren’t a substitute for people in the trenches gathering data at street level and reporting back to the Mother ship.

I’d like to see a web site that had all the features the consumer wants—then sell it to the local real estate boards since they can’t seem to think of these ideas on their own.