Proposition 19 vs 13−Confusion Continues to Abound

Many people feel Proposition 19 was “snuck in” or that voters didn’t fully realize what they were agreeing to. Ever since it passed, there’s been a lot of confusion and frustration. The takeaway is that it’s essential to really understand what’s on the ballot before casting a vote.

The part that confuses most people is who Prop 19 actually impacts. The truth is, it mainly affects people who inherit a home but don’t plan to live in it themselves.

How Prop 19 Works for Inherited Homes

  1. If You Move In
    • If you inherit a family home and make it your primary residence, you can keep the low property tax base your parent or grandparent had.
    • But there’s a limit: if the market value is more than $1 million higher than the old taxable value, the amount above that gets added to your new tax base.
    • Example: If the old taxable value was $300,000 and the home is worth $1.6M when transferred, the new taxable value becomes $600,000. Unaffordable? Remember, these inherited homes typically come with no mortgage payment.
  2. If You Rent It Out
    • If you inherit a property and don’t live in it (for example, you turn it into a rental), it’s reassessed at full market value. That means you lose the lower tax base your parent or grandparent had.

Why the change? It comes down to trade-offs. Prop 19 gave homeowners a valuable new benefit: the ability to transfer their low property tax base to any location in California when they move. However, to offset the cost, the state decided that heirs who use inherited property as an investment—not as a primary home—should pay property taxes based on today’s market value.

Put simply, if you live in the home, you retain most of the old exclusionary tax break. If you turn it into an income property, the state treats it like any other investment. While it may feel harsh, the intent was to make the system fairer by ensuring investors pay their share, while still protecting families who truly keep the home as their residence.

Prop 13 vs. Prop 19: Key Differences

FeatureProposition 13 (1978)Proposition 19 (2020)
Property Tax RateCapped at 1% of assessed valueStill capped at 1% (Prop 19 did not change this)
Annual IncreasesAssessed value can rise max 2% per yearSame 2% cap applies
Reassessment TriggerReassessed at market value when sold or newly builtSame rule applies
Parent-to-Child / Grandparent-to-Grandchild TransfersHeirs could keep the low tax base on homes (and sometimes rentals) without limitsHeirs can keep the low tax base only if they move in and use it as their primary residence. If rented out, reassessed at market value
Value Limit for Inherited HomesNo value limit; heirs kept original tax base regardless of property’s market valueTax base is kept only up to $1 million above the original assessed value (adjusted for inflation). Anything over is added to the tax base
Moving Low Tax Base to a New HomeOnly allowed for people 55+ or disabled, and only within the same county (or limited counties)Homeowners 55+, disabled, or wildfire victims can transfer their low tax base anywhere in California up to 3 times
Overall GoalKeep property taxes stable and predictable for long-term ownersExpand portability of tax savings for older/disabled homeowners, while limiting tax breaks on inherited investment properties

Drew and Christine Morgan are experienced REALTORS and NOTARY PUBLIC located in Belmont, CA, where they own and operate MORGANHOMES, Inc. They have assisted buyers and sellers in their community for over 30 years. Drew and Christine have received the coveted Diamond award, ranking among the top 50 agents nationwide and the top 3 in Northern California by RE/MAX. To contact them, please call (650) 508.1441 or emailinfo@morganhomes.com.

For all you need to know about Belmont, subscribe to this blog right here. You can also follow us on Facebook and on X.

This article provides educational information and is intended for informational purposes only. It should not be considered real estate, tax, insurance, or legal advice; it cannot replace advice tailored to your situation. It’s always best to seek guidance from a professional familiar with your scenario.

BROKER | MANAGER | NOTARY

You’ve Lived Through Hundreds of Solstices and Equinoxes—Time to Finally Find Out What they Actually are…

Equinox vs Solstice

Things happen four times a year, whether you notice them or not—and odds are, you’ve just lived through one without even realizing it. We’re talking about the winter and summer solstices and the spring and fall equinoxes. If you’re around 50 years old (and have managed to stay on this planet the whole time), congratulations: you’ve racked up about 200 of these cosmic milestones… and may still have no idea what just happened.

Curious? You should be! The equinoxes—from the Latin aequus (equal) and nox (night)—are the moments when day and night share a truce, giving us almost equal daylight and darkness. Easy to remember, right? Meanwhile, the solstices—from sol (sun) and sistere (to stand still)—mark the Sun’s “pause button” in the sky, creating either the longest day or the longest night of the year.

So the next time you’re marveling at how dark it gets at 5 p.m. or why the sun won’t set until after dinner, remember: you’re not just annoyed at daylight savings—you’re witnessing an ancient celestial event. 🌞🌍

Click here for a more in-depth explanation for the science-minded folks out there…

Drew and Christine Morgan are experienced REALTORS and NOTARY PUBLIC located in Belmont, CA, where they own and operate MORGANHOMES, Inc. They have assisted buyers and sellers in their community for over 30 years. Drew and Christine have received the coveted Diamond award and ranked among the top 50 agents nationwide and the top 3 in Northern California by RE/MAX. To contact them, please call (650) 508.1441 or emailinfo@morganhomes.com.

For all you need to know about Belmont, subscribe to this blog right here. You can also follow us on Facebook and on X.

This article provides educational information and is intended for informational purposes only. It should not be considered real estate, tax, insurance, or legal advice; it cannot replace advice tailored to your situation. It’s always best to seek guidance from a professional who is familiar with your specific scenario.

BROKER | MANAGER | NOTARY

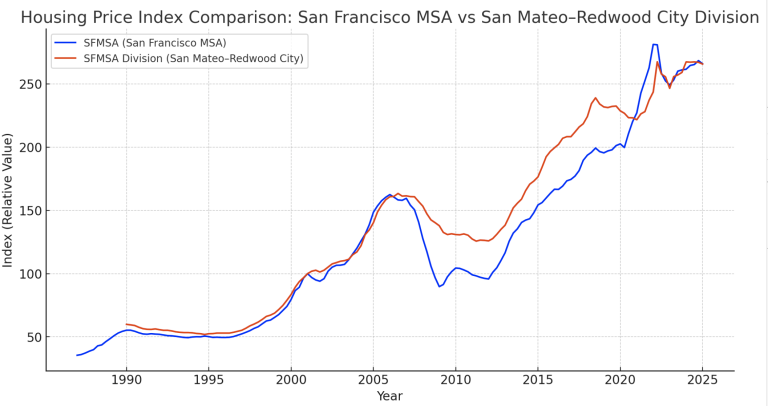
Which Pays More? Comparing San Francisco MSA and San Mateo–Redwood City Housing Returns

SFMSA va MSAD

Bay Area Housing Showdown: San Francisco Metro vs. the Peninsula

Until recently, the famous Case-Shiller housing reports lumped the entire Bay Area into the San Francisco MSA—covering Alameda, San Francisco, Marin, San Mateo, and Contra Costa. That broad view smoothed out some of the ups and downs, but it also mixed fast-growing markets with slower ones.

As the population pushed past 2.5 million, analysts carved out a new sub-market: the San Mateo–Redwood City Division, which focuses more on the Peninsula. While this still includes some underperformers (like Daly City and South San Francisco), it’s a welcome step toward highlighting mid-Peninsula dynamics.

So how do the two compare?
If you had invested in 1990, the San Francisco MSA would have returned about 8% more than the Peninsula division. But here’s the twist—those extra gains came with more volatility. The Peninsula, while slightly behind in raw returns, offered a smoother ride.

Growth Since 1990

  • San Francisco MSA (metro-wide)
    • Total Growth: +381%
    • CAGR: ~4.6% annually
  • San Mateo–Redwood City Division
    • Total Growth: +344%
    • CAGR: ~4.3% annually

🔑 Insight: The metro-wide San Francisco market slightly outperformed the Peninsula Division in both cumulative growth and annualized return.

SFMSA vs MSAD

📊 Volatility & Cycles

  • San Francisco MSA
    • Bigger swings during the dot-com bust (2000–2002) and 2008 housing crash.
    • More dramatic rebounds in the tech booms (2012–2022).
    • Essentially more “leveraged to tech cycles.”
  • San Mateo–Redwood City Division
    • Tracks very closely but with slightly milder peaks and troughs.
    • The Peninsula benefits from strong fundamentals (jobs, income, schools) but didn’t surge quite as aggressively in the big runups.

🏆 Which is the Better Investment?

  • San Francisco MSA (metro-wide):
    Better for maximum long-term appreciation, but you need tolerance for volatility.
  • San Mateo–Redwood City Division:
    Slightly lower growth, but steadier and less extreme in downturns. Likely better if you prioritize stability and resilience over maximum upside.

👉 In short:

  • Metro (SFMSA) = higher growth, higher volatility.
  • Peninsula (Division) = steadier, still strong, but slightly less aggressive growth.

Here’s the investment scenario analysis (1990  2025) for a $500,000 purchase in each market:

  • San Francisco MSA (metro-wide):
    $500,000 
     ~$2.40 million
  • San Mateo–Redwood City Division (Peninsula):
    $500,000 
     ~$2.22 million

📊 Our Interpretation

  • Both markets delivered excellent long-term gains.
  • The metro-wide San Francisco market outperformed by about $186,000 over 35 years.
  • The Peninsula provided nearly the same wealth-building power but with slightly smoother cycles.

👉 In other words, investing in the SF metro as a whole yielded ~8% more wealth by 2025, but the Peninsula may have offered a calmer ride with fewer sharp downturns.

* Note that The MSAD is also a part of the larger MSA data−So in effect the Peninsula market helped the numbers in the San Francisco MSA market.

Drew and Christine Morgan are experienced REALTORS and NOTARY PUBLIC located in Belmont, CA, where they own and operate MORGANHOMES, Inc. They have assisted buyers and sellers in their community for over 30 years. Drew and Christine have received the coveted Diamond award and ranked among the top 50 agents nationwide and the top 3 in Northern California by RE/MAX. To contact them, please call (650) 508.1441 or emailinfo@morganhomes.com.

For all you need to know about Belmont, subscribe to this blog right here. You can also follow us on Facebook and on Twitter.

This article provides educational information and is intended for informational purposes only. It should not be considered real estate, tax, insurance, or legal advice; it cannot replace advice tailored to your situation. It’s always best to seek guidance from a professional familiar with your scenario.

BROKER | MANAGER | NOTARY

135 Lynton Avenue, San Carlos

Tucked away on a private drive in the scenic San Carlos hills, this secluded sanctuary offers the kind of privacy and peace that makes you wonder if you accidentally booked a five-star mountain resort for life.

From the moment you arrive, you’ll be greeted by a grand entrance that practically rolls out the red carpet. Step inside and you’ll find soaring ceilings, celestial windows, and a flood of natural light that makes you look good even before your first coffee.

And oh, the outdoors! Throw open the glass nano doors and step into your very own club-style retreat. Lounge by the sparkling pool, soak in the spa, or fire up the grill—all while gazing across rolling canyons and rural vistas that are as good for the soul as they are for your Instagram.

Inside, every detail has a flair for the dramatic—modern light fixtures, sleek wall dimmers, and bathrooms that feel more like mini art galleries. Toto® toilets bring the spa vibes, and each bath surprises you with its own creative mix of stone, metal, and luxury.

Working from home? You’ll love the spacious private office that whispers productivity (but also lets you take Zoom calls in your slippers).

The kitchen? A dream for the serious chef—or serious takeout connoisseur. Slate-look cabinetry, jaw-dropping marble counters, and high-end appliances from Thermador® and Miele® are all here to elevate your culinary game. There’s even a built-in espresso machine to keep you caffeinated and fancy.

Need laundry? There’s a sleek LG® washer/dryer set tucked smartly in a utility closet, conveniently close to the kitchen and pantry—because sometimes you want your laundry day as seamless as your morning latte.

In short, this is not just a home—it’s an experience. A place where luxury meets tranquility and every day feels like a weekend away.

Come see it. Feel it. Fall in love with it.

Clear Cooperation or Clear Conflict? Insider’s Look into the Compass-Zillow MLS Showdown

Conflict of Interest

What’s Going On Between Compass and Zillow?

You may have seen news stories lately about a fight between the real estate company Compass and the home search giant Zillow. The argument centers on something called the Clear Cooperation Policy, a rule created by the MLS (Multiple Listing Service). Some of the news articles covering this are missing key insights—likely because the writers aren’t real estate professionals and may be relying too much on the messaging from one side or the other.


First, What Is Clear Cooperation?

The MLS is a shared database REALTORS® use to advertise homes for sale. It’s designed to give every agent access to all available listings so buyers get maximum property exposure.

The Clear Cooperation Policy was introduced to prevent agents from secretly marketing homes to a limited group, often through private platforms or within their firms, before making them available on the MLS. This off-market selling, sometimes called “pocket listings,” can limit competition and reduce a seller’s chance of getting the best price.

While MLS policy’s stated goal is fairness and transparency, the deeper reason is likely to protect the MLS’s relevance. If agents stop using the MLS and rely only on their own networks, the whole system becomes less valuable.


Why Off-Market Listings Are a Problem

Off-market listings are like messages stored in a private inbox you rarely check—you might miss them entirely unless you’re actively looking. That’s called “pull” technology.

On the other hand, MLS listings are like notifications “pushed” straight to your phone—they show up automatically, and you see them right away.

When a home is listed off-market, only a limited group of buyers hear about it. That usually means less exposure, fewer offers, and lower competitionwhich can hurt the seller’s bottom line.

While we sometimes use off-market listings during the prep phase of a sale (like while staging or photographing the home), we don’t keep them that way for long, because limiting market saturation usually isn’t in the seller’s best interest.


What Compass Is Doing

Compass, a large real estate brokerage, is trying to keep more of its listings “in-house”, meaning it only shares them with other Compass agents. This gives them a shot at representing both the buyer and the seller in the same deal—what’s called dual agency—and collecting oftentimes double the compensation.

Here’s the issue: When your agent is part of a dual agency deal, their legal fiduciary duty to act only in your best interest becomes divided. They can’t fully advise you against the buyer’s offer or suggest ways to negotiate, because they’re also obligated to the buyer through another agent at their brokerage.


Why This Matters to You

If you’re selling your home and your agent is pressured to keep your listing within their own company (like Compass), you may lose:

  • Wide exposure to all potential buyers.
  • Unbiased advice about offers or pricing.
  • The chance to spark competitive bidding that could raise your sale price.

Compass argues that off-market buyers might pay more to avoid competition, but if that’s true, why not open the listing up to everyone and see who offers the most? That’s what’s fair—and likely to get you the best result.


The Bottom Line

Compass wants more control over listings and commissions. Zillow and the MLS want to keep all listings publicly accessible so the system stays fair and competitive. Neither party is purely looking out for you, the client—they’re both protecting their business models.

As always, the best decision is one that puts your interests first, not your agent’s brokerage.

Drew and Christine Morgan are experienced as BROKER, REALTORS, and NOTARY PUBLIC located in Belmont, CA, where they own and operate MORGANHOMES, Inc. They have assisted buyers and sellers in their community for over 30 years. Drew and Christine have received the coveted Diamond award and ranked among the top 50 agents nationwide and the top three in Northern California by RE/MAX. To contact them, please call (650) 508.1441 or emailinfo@morganhomes.com.

For all you need to know about Belmont, subscribe to this blog right here. You can also follow us on Facebook and on Twitter.

This article provides educational information and is intended for informational purposes only. It should not be considered real estate, tax, insurance, or legal advice; it cannot replace advice tailored to your situation. It’s always best to seek guidance from a professional familiar with your scenario.

BROKER | MANAGER | NOTARY

San Mateo County Housing Stays Hot, But Inventory Surge Signals Shift

Here’s a clear breakdown of what’s happening in the San Mateo County (SMC) housing market from 2024 to 2025 based on data from the MLS for Q1.

Key Highlights:

  • New Listings: Up 16.7% — more sellers are entering the market.
  • Homes Sold: Barely up (+2.6%) — demand is steady but not surging with the new supply. This increases the Inventor levels as buyers are uncertain about the economic future.
  • Inventory: Up a big 57.8% — supply has increased significantly. Bidding wars are waning. This will slow the rate of home appreciation.
  • Average Days on Market (DOM): Down 11.1% (from 27 to 24 days) — homes are selling slightly faster despite higher inventory, suggesting continued demand.

Prices & Valuation:

  • Average Sale Price: Up 6.7% ($2.44M ➡️ $2.61M) — strong upward pressure on prices.
  • Median Sale Price: Up 4.7% ($1.91M ➡️ $2M) — supporting the trend that the broader market, not just luxury homes, is appreciating.
  • Median $/SqFt: Up 3% — price growth per square foot is solid but more moderate, suggesting that larger homes might be contributing to the higher overall sale prices.
  • % List Price Received: Up from 104% ➡️ 107% — buyers are paying even more over asking, indicating competitive offers remain.

Volume & Sizes:

  • Total Sale Volume: Up 9.4%—Higher prices and slightly more sales have lifted the total dollar volume since sales only increased 2.6%.
  • Average Home Size: Up 2.5% (2055 to 2107 sqft) — larger homes selling might be nudging up average prices. If the average home price went up 6.7 % but 2.5% of that was due to larger homes selling, a YOY average sale price percentage would be reduced to 4.2%.

Market Dynamics:

  • Months of Inventory: Up 57.1% (from 1.4 to 2.2 months) — still a seller’s market (under 3 months), but it’s becoming more balanced due to buyer jitters.

Summary Insight:

The SMC housing market in 2025 looks like it’s in a hot but slightly more balanced phase:

  • Supply has risen sharply, but demand is keeping pace (homes are selling faster, prices are up, and bidding is competitive, just not as much so).
  • The increase in larger home sales might be boosting both the average sale price and the sales volume.
  • Inventory is building, which could give buyers slightly more leverage in the coming months if the trend continues.
  • Fed. interest rates remained unchanged.

Commentary: With all the uncertainty around tariffs, buyers are taking the classic “wait-and-see” approach — emphasis on the wait. One thing they’re sure of? Their stock portfolios took a hit… but hey, it’s only a loss if they cash out to buy that house, right? Yet another reason to stay on the sidelines a little longer and let the dust (and the Dow) settle.

The Risk Reward? Buy now while prices are climbing a little and bidding wars are catching their breath — or wait with the crowd for “more certain times” and join the stampede when the bidding starts up full throttle again.

Drew and Christine Morgan are experienced REALTORS and NOTARY PUBLIC located in Belmont, CA, where they own and operate MORGANHOMES, Inc. They have assisted buyers and sellers in their community for over 30 years. Drew and Christine have received the coveted Diamond award and ranked among the top 50 agents nationwide and the top 3 in Northern California by RE/MAX. To contact them, please call (650) 508.1441 or emailinfo@morganhomes.com.

For all you need to know about Belmont, subscribe to this blog right here. You can also follow us on Facebook and on Twitter.

This article provides educational information and is intended for informational purposes only. It should not be considered real estate, tax, insurance, or legal advice; it cannot replace advice tailored to your situation. It’s always best to seek guidance from a professional familiar with your scenario.

BROKER | MANAGER | NOTARY