How to put historical interest rates vs home values into perspective.
It’s hard to predict where internet rates will take home values, but as history has shown, it can be a Fool’s Game to try and play the market. Akin to the depiction in this post, the consequences can be painful.
Take for example Interest rates in August of 1993—they stood at 6.97%. By November of 1994—just 15 months later they were up 2.28% ↑ to 9.25%. How did home prices react to the sharp increase in interest rates? The went up .52% points during the same period—no dramatic dip that made it worthwhile to try and wait out the effects of higher rates.
Here’s a real-world example. Let’s say one bought a $2,000,000 home today with a 4.5% interest rate. A monthly interest payment would be ~$1,000 less each month than if the rates go up to 5.5%. Here’s an on-line calculator to run scenarios.
What does $1,000 a month translate into purchasing power? In the above example, $200,000. Which means that if the rates go up to 5.5%, home values would have to drop in step with that increase 10% for one to just breakeven vs buying now at 4.5%. Why wait for a higher 5.5% rate to put downward pressure on home prices—which as history as shown, there’s no guarantee will happen.
In our observations, being in the sector of tech heavily weighted jobs, wherein many are reliant on stock options for their downpayment, any hit to the financial markets makes it unlikely that buyers will liquidate stocks to buy a home. In our world, that and job security (e.g. Consumer Confidence—which is up recently), has a greater impact on buying activity than interest rates.
Drew & Christine Morgan are REALTORS/NOTARY PUBLIC in Belmont, CA. with more than 30 years of experience in helping sellers and buyers in their community. As Diamond recipients, Drew and Christine are ranked in the top 50 RE/MAX agents nationwide and the top 3 in Northern California. They may be reached at (650) 508.1441 or emailed at info@morganhomes.com.
The information contained in this article is educational and intended for informational purposes only. It does not constitute real estate, tax, insurance or legal advice, nor does it substitute for advice specific to your situation. Always consult an appropriate professional familiar with your scenario.
In Belmont, the sales statistics for May 2022 show that the inventory of homes has grown to one month of inventory, while this past January it stood at .3 months. To help put that into perspective, during the downturn in 2009, the months of available inventory in Belmont sat at 10.
While some homes are still selling over the asking price, they are on average receiving 10% less over asking than in Q1.
Some of these anomalies are seasonal, and as such, with May being a month that is affected by seasonality in home sales, some of what the market is experiencing is seasonal and normal.
The most recent sales in Belmont are for far less than the sales in January-April. That is of course when the February interest rate hikes really kicked in, coinciding with the stock market taking a hit.
Since many Bay Area buyers are tech workers, whose compensation is augmented to a high degree with stock options, when the stocks are high, buyers are more bullish and can compete in the home bidding process by liquidating more stocks. Conversely, when the stock market takes a hit, buyers not only have less capital to work with, but they also tend to sit back and wait for the market to stabilize before liquidating their holdings.
Where We Stand Today
This graph illustrates the rapid rise in the 30-year mortgage rate this year. We suspect that much of the overzealous bidding that occurred in the first quarter of 2022 was due to buyers’ knowledge that rates were scheduled to rise, and their desire to take advantage of lower rates while they could—even if that meant overpaying in a bidding war for a home.
The S&P 500 and home values seem inextricably connected. One can see in this graph the rise and decline during that same Q1 period that buoyed purchasing power and is now waning.
As seen in this graph for all sales in San Mateo County, Condominium values take a hit first. We attribute this to two factors. The first being that condominiums tend to be akin to a commodity. Many are similar if not nearly identical. There are of course varying degrees of upgrades, whether one has an end or upper floor unit, the location within the complex, but overall, the differentiating factor in a market with growing inventory, comes down to price.
The secondary factor is that as prices and competition for single family homes fall, condominium owners have an opportunity to make a move into a stand-alone home, while buyers who were just shy of being able to purchase a home, and would have bought a condo, now turn to owning a home with a yard.
What is Different Now
What has changed is that with fewer buyers in the market, and less competition, they can be choosier. While it’s still too early to call it a buyer’s market across the board, certain sectors such as the condominium market and cities, and even neighborhood within cities that are less desirable, are most affected.
This means that not every home will sell—at least like they did in the past. Homes will have to be spruced up, staged, show well, and most likely be vacant to garner the level of excitement necessary to captivate the dwindling pool of buyers, so as not to take an inordinate hit on the sale price.
For the typical three-bedroom home, looking at the sales in Belmont, between March and April the seller’s enjoyed a list to sales price ratio of 119%. Since April that has dropped 11% to 108%. With the median home price still hovering around $2,400,000, that represents a $250,000 decrease in overbidding per home.
Buyers are in shock because for the past 20 years, 30-year mortgage rates averaged 3.035%. They never knew rates prior to that 20-year period when between 1980 and 2000 they averaged 10.3%. And the average 30 mortgage rate since 1971 when interest rates were tracked, is 7.7%. Buyers who have never even heard of an interest rate over 4% will acclimate and become accustomed to the new norm, and life will go on. Longer term homeowners who have lived through the interest rate roller coaster ride, will be less effected emotionally, and probably move forward with life’s plans accordingly.
Drew & Christine Morgan are REALTORS/NOTARY PUBLIC in Belmont, CA. with more than 25 years of experience in helping sellers and buyers in their community. As Diamond recipients, Drew and Christine ranked in the top 50 RE/MAX agents nationwide and the top 3 in Northern California. They may be reached at (650) 508.1441 or emailed at info@morganhomes.com.
The information contained in this article is educational and intended for informational purposes only. It does not constitute real estate, tax, insurance or legal advice, nor does it substitute for advice specific to your situation. Always consult an appropriate professional familiar with your scenario.
One would think that predicting the seasonal course in our local housing market wouldn’t be that hard, right? What makes people decide whether now is the time to buy or wait on the sidelines? We’re not sure exactly what one thing it is, or if it even is one thing at all. More likely it’s a mix of factors that plays into their emotions, but one thing is in common—when buyers pull back, they almost all do it in sync—almost like the young, amateur traders transforming markets.
The Pandemic Changed the Norms
Prior to the Pandemic we took great pride in prognosticating seasonal real estate cycles by examining past performance of the market at various times of the year and during various cyclical events. Take for example election years. Whether it’s a presidential election year that stands to be decisive, such as Trump v. Biden, or even a less momentous mid-term election, we were pretty much guaranteed to realize a buyer pull-back from late September through mid-November. That was just one of the expectations that we had to throw out the window in 2020.
Of course, the stock market swinging wildly sets people off, and any hint of tech companies laying people off sends the pool of buyers into hibernation.
We had a lot of variables stacking up signaling buyers may take a siesta from house hunting during the Pandemic while jobs, the economy, really the entire future was in unchartered waters, but instead buyers came out in droves snapping up everything and anything so long as it had a yard—go figure. While in hindsight we can see the motivations for many of these first-time buyers jumping into the market—working from home while home-schooling two children in a 900 square foot apartment with not even a yard for sustenance is enough to get any procrastinator off the fence, though we certainly wouldn’t have bet on it.
We started this year with unemployment moderating, but inflation gathering steam, the “R” word entering economists’ vocabulary again, and threats of war in Ukraine which stood to further impact prices. Yet in Q1 we saw one of the biggest bull runs in the housing market we’ve seen in years.
While the median home price in San Mateo County went up 7% between Q1 of 2021 and Q1 of 2022, in Belmont the increase in those two periods was 28%.
So, what’s in store for Q2? Where is the market headed now as the landscape changes?
Even the mention of possible interest rate hikes tends to knock a lot of buyers off of the fence as they finally realize that the luxury they had to purchase a home “whenever”, knowing the rates would always be low, may be coming to a close. It’s odd too, as rates were nearly as high in 2019 and nobody seemed to care.
We didn’t so much as predict what would happen when the government artificially kept mortgage rates low after the Great Recession housing debacle in 2007, it was more akin to watching a plane crash from the sky. You don’t have to see it hit the ground to know what will happen. So, what IS happening that we knew would be inescapable? Homeowners who refinanced or buyers who purchased a home when rates were at historic lows—in the 2-3% range, aren’t going to be selling their home and moving anytime soon. Sure, in California they can now carry their low property tax base, but they can’t carry their low interest rate—so many are going to stay put and there will be even less inventory than there has been, and which will once again put upward pressure on housing prices.
However, the current rise in interest rates will have a mitigating effect on any upward pressure on home prices.
The current rates for mortgages that went from 2.5% to 5.2% now makes the monthly mortgage payment on a median price home in Belmont go up more than $4,000 a month, which is a 33% increase. Effectively, that means a buyer’s purchasing power just dropped by
~ $650,000.
What we cannot predict is the outcome of how the collision of these two contrasting forces will end.
The short of it is we don’t know what buyers will do going forward. Will they wait for a while to see if rates come back down, or jump in before they go higher? Or, will they jump in anyway while others are sidelined and refinance later? Will it put a cap on over bidding? Will higher interest rates dissuade homeowners from selling even if it’s to downsize, to keep a lower payment/interest rate? Will that be enough to throttle back inventory further to mitigate the impact of fewer buyers in the market?
On a micro scale, we have seen a recent slowdown in heightened level of enthusiastic home buying activity in the last few weeks, but then again we see that every year near tax time, Easter and Spring breaks—stay tuned.
Drew & Christine Morgan are REALTORS/NOTARY PUBLIC in Belmont, CA. with more than 25 years of experience in helping sellers and buyers in their community. As Diamond recipients, Drew and Christine are ranked in the top 50 RE/MAX agents nationwide and the top 3 in Northern California. They may be reached at (650) 508.1441 or emailed at info@morganhomes.com.
The information contained in this article is educational and intended for informational purposes only. It does not constitute real estate, tax, insurance or legal advice, nor does it substitute for advice specific to your situation. Always consult an appropriate professional familiar with your scenario.
Nothing remains the same, except change—with each change being slightly different than the one before…
By The Numbers
Now that the waning dog days of summer are upon us, we felt it was time to summarize the second quarter sales for the year. I mean, doesn’t everyone want to know, “How is the Market”? It’s the question posed to us most frequently, and I guess rightly so. After all, for many, ok, I’ll expand that for most people, their Bay Area home is their largest asset—their nest egg. It’s akin to people in other areas of the country, where home prices are more understandable, tracking their 401k’s, stock performance, or their own bank accounts on a daily basis.
When the market takes a nose dive again, and it will, if you’re anywhere near retirement, you had better have a plan “A” now, or you’ll invariably be implementing the alternative, plan “B”, which means you might just get stuck in retirement purgatory waiting for the values to come back so you can cash-out on all of that equity you once had.
This is also the time of year when many of my colleagues come to me in hushed voices wearing ghastly, pasty facial expressions contorted into the most unpleasant sight and reeking of fear, asking me if I noticed that the market is down…that there’s been a shift, and did I notice it, and do I feel the same way. I don’t. I’ve been tracking home sales statistics for my entire career, and it’s normal, heck it’s expected that in the summer the market slows. In typical fashion, agents will post these dire statistics from summer to what amounts to nothing more than fear mongering. Of course the market has slowed down, its summer!
Why? Because people have lives—and they go live them. It’s interesting to observe that the better the economy, the more pronounced how this housing hiatus manifests itself—more money, more market confidence, means you might as well pack up the family and head off for an extended vacation to some romantic or adventures place, like Disneyland. Because let’s face it, once the kids are out of school, parents have to do something to burn off that pent-up energy and it’s certainly not going to be tamed traipsing around open houses every weekend.
Then there’s the inarguable fact that the high bidders for homes in the spring market have already won. They’ve got the home they want, and now they’re leaving the housing hunt rat race in the dust and soaking up all of the equity future buyers will be serving up to them on a silver platter.
So instead of looking back at the spring market and wishing our business was just as brisk and our pipeline as full, we do what one should do and that is to compare and contrast the same period year-over-year to better understand, without hyperbole, pre-conceived notions, or hysteria, what the heck is really going on.
To this we look at the entire market of San Mateo County. It gives us a better more macro view of home trends than say limiting our analyses to a small town like Belmont, however charming it is, but also highly susceptible to wild swings in its small market sample size.
Here we see a different story emanating from the lines of a spreadsheet. The market isn’t down, any more than it should be for this time of the year, and in fact it’s quite strong.
The median home price for San Mateo County in Q2 rose $185,000 YOY or 13%, while sellers also enjoyed receiving 3% more over their asking price.
The number of new listings was up 9%, while sales were down 4%, causing the housing inventory to rise an aggregate 19%.
So the sky isn’t falling. The activity in the market is not quite as brisk, but with all that meddling in people’s mortgage tax deductions that’s to be expected. Now, everyone can go back into their happy place imagining that home values will always go up in the Bay Area with the trajectory of a missile launch, until that missile misfires and lands right back from where it took off.
Drew & Christine Morgan are REALTORS/NOTARY PUBLIC in Belmont, CA. with more than 20 years of experience in helping sellers and buyers in their community. As Diamond recipients, Drew and Christine are ranked in the top 50 RE/MAX agents nationwide and the top 3 in Northern California.They may be reached at (650) 508.1441 or emailed at info@morganhomes.com.
The information contained in this article is educational and intended for informational purposes only. It does not constitute real estate, tax or legal advice, nor does it substitute for advice specific to your situation. Always consult an appropriate professional familiar with your scenario
Do you remember proposition 13? If you do, you probably own a home, but prop 13 may be dying a slow death, at least for industrial and commercial properties.
THE BACKSTORY: On June 6th, 1978, nearly two-thirds of California’s voters passed Proposition 13, reducing property tax rates on homes, and businesses by about 57%. Proposition 13 forever altered the way property taxes would be levied on real property, or so voters were promised.
Under Proposition 13 tax reform, property tax value was rolled back and frozen at the 1976 assessed value level. Property tax increases on any given property were limited to no more than 2% per year as long as the property was not sold. Once sold, the property was reassessed at 1% of the sale price, and the 2% yearly cap became applicable to future years.
Prior to Proposition 13, the property tax rate throughout California averaged a little less than 3% of market value. Additionally, there were no limits on increases for the tax rate or on individual ad valorem charges. (“Ad valorem” refers to taxes based on the assessed value of property). Some properties were reassessed 50% to 100% in just one year and their owners’ property tax bills increased accordingly.
But change is inevitable, and that’s exactly what proponents of the newly proposed initiative are counting on.
WHAT’S IN STORE: A new ballot initiative that takes aim at how commercial properties are taxed under California’s Proposition 13 could raise $6 to $10 billion more each year for schools and other programs and services, according to a new analysis by the Legislative Analyst’s Office.
At the heart of the initiative, (which is still being reviewed by the state attorney general’s office), is a property tax law enshrined in the state constitution since 1978. Proposition 13 caps taxes for all kinds of properties — residential and commercial — at 1 percent of a property’s purchase price, allowing for increases of no more than 2 percent per year, even if the value of the property triples or quadruples over time.
The initiative would change the constitution so that commercial and industrial properties — and land not intended for housing development — are instead taxed based on their current market value. The idea, long favored by critics of Proposition 13, is often called a “split roll” since it would not affect protections for residential properties. Businesses whose total property holdings are valued below $2 million would be exempt.
Supporters of the ballot initiative include the League of Women Voters, California Calls, PICO California and other civic and community groups.
But that’s not the end it. The California Association of REALTORS wasn’t to put more teeth into the initiative by adding an initiative to the proposition 13 overhaul that changes how those homeowners over 55 can transfer their tax base.
Currently, Proposition 60, enacted into law in 1986, allows for the one-time transfer of your current home’s tax base to a replacement property of equal or lesser value after the age of 55 of either spouse, providing that the replacement property was located within the same county.
The problem for most people wishing to benefit from this tax base transfer is they are limited to moving within the county in which they currently reside, or moving to one of only a handful of reciprocal counties (Alameda, Los Angeles, Orange, San Diego, Ventura, San Mateo, Santa Clara, or El Dorado).
The new proposed initiative tied to proposition 13 amendments would allow homeowners over 55 to carry with them their current tax base whenever, (as many times as they like), and wherever they move—so long as they stay within California.
Proponents of the initiative say it will help free up the housing inventory shortage, as many long-time homeowners are reticent to move if they can’t carry their low tax base. While opponents, such as San Francisco-based YIMBY Action, a pro-development, millennial-led group say that this initiative is just helping the rich get richer—implicit in their argument is that if you own a home, you must be rich.
Thanks to the San Jose Mercury for providing much of the article’s investigative analysis and insight.
Drew & Christine Morgan are REALTORS/NOTARY PUBLIC in Belmont, CA. with more than 20 years of experience in helping sellers and buyers in their community. As Diamond recipients, Drew and Christine are ranked in the top 50 RE/MAX agents nationwide and the top 3 in Northern California.They may be reached at (650) 508.1441 or emailed at info@morganhomes.com.
The information contained in this article is educational and intended for informational purposes only. It does not constitute real estate, tax or legal advice, nor does it substitute for advice specific to your situation. Always consult an appropriate professional familiar with your scenario
When a home is underpriced, or overpriced for that matter, it often has to do with the fact that the listing agent is from out of the area. They miss the mark because in their home turf, homes may be selling for less (or more) than where their listing is located, and when they apply their native pricing strategies to a listing they have out of the area, they can be pretty far off at times.
The same goes for an agent who represents a buyer in an area where they’re not as familiar with the local home values. They may grossly overestimate a home’s worth, based upon their experience in the area where they concentrate, thus recommending an offer price to a buyer that is too high and artificially driving the prices up.
Then there’s the phenomenon known as the “Winner’s Curse”, hence while you may be winning the bid, you’re actually losing. The winner’s curse may occur in any auction where less than complete information is available. The winner’s curse says that in such an auction, the winner will tend to overpay. The winner may overpay or be “cursed” in one of two ways: 1) the winning bid exceeds the intrinsic value of the asset or 2) the value of the asset is less than the bidder anticipated, so the bidder may still have a net gain, but will be worse off than anticipated.
The Winner’s Curse phenomenon also manifests itself in the home buying process in several additional ways, some of which are introduced by the buyers.
When a buyer tries to outbid their competition by purposefully offering more than the home should be worth, just to win the auction, they may win the bid, but by definition, they paid too much, since the average bid typically defines the value, and the winning bid is the outlier.
Since homes are not a commodity, as in oil or gas for example, wherein the value is pretty well understood and, more importantly, oil is oil and it either makes sense to purchased it at “x” price or it doesn’t. Wherein when it comes to homes, at least those located outside of tract areas, are unique unto themselves, and buying a similar home may not be nearly as emotionally appealing. In this way, it’s more like adopting a child, no two are the same.
From a listing agent’s standpoint, pricing a home at the selling price of the home across the street typically backfires. Here’s why. Let’s say that the home across the street was listed at $1,000,000, and sold with ten offers for $1,400,000. The high bidder, who won the bid, and by definition paid too much—because they paid more than any other buyer was willing to bid—is now out of the pool of potential bidders for the next home—the one you just listed across the street. This means out of the nine residual buyers, none were willing to pay $1,400,000 and some may have even already moved on, or are in contract on another home. What did the other nine buyers bid? Only that listing agent will ever know, but the next highest bidder is the one you need to attract and who knows how much they offered. And this of course assumes that the homes are identical—which they never are. The second highest bidder might not even like your listing, might be out of town the week you go on the market, which means now you are relegated to the third, fourth, or fifth bidders in order of their declining tolerance for bidding or ability to pay.
This is one reason agents will intentionally list a home at what seems to be irresponsible—far below what it might eventually sell for, based upon the recent comparable sales in the area. And while this practice might be viewed by some as false advertising, which is illegal, as the home might well be priced lower than recent sales, it might actually be priced appropriately for its intrinsic value.
In residential real estate valuation, there are several ways to ascertain the intrinsic value of a home. The three accepted practices in real estate are known as the Comparative Market Approach, also known as the sales comparison approach, the Principle of Substitution, (what else could I buy), and the Cost Approach, (how much would it cost to build a similar home from scratch).
Agents and buyers alike tend to rely heavily on the sales comparison approach, as it makes sense to compare the home they are buying to those which have recently sold, but if the buyers are bidding too much on homes, than the comparable sales are less trustworthy, and looking at the Cost Approach, or what it would cost to build a new home might be more effective, if nothing more as a check and balance against the price one might offer.
Drew & Christine Morgan are REALTORS/NOTARY PUBLIC in Belmont, CA. with more than 25 years of experience in helping sellers and buyers in their community. As Diamond recipients, Drew and Christine are ranked in the top 50 RE/MAX agents nationwide and the top 3 in Northern California.They may be reached at (650) 508.1441 or emailed at info@morganhomes.com.
The information contained in this article is educational and intended for informational purposes only. It does not constitute real estate, tax or legal advice, nor does it substitute for advice specific to your situation. Always consult an appropriate professional familiar with your scenario
DAILY REAL ESTATE NEWS | THURSDAY, NOVEMBER 30, 2017
Some home sellers would need a sale contract inked before the end of 2017 in order to avoid a big tax bill that would be imposed if the GOP tax reform proposals become law. Both the House and Senate bills would require sellers to have lived in their residence for a longer period of time before qualifying for the capital gains tax exclusion on the sale of a primary home. They would have to live in their house at least five years out of the last eight; right now, the requirement is two years out of the last five.
The Senate version, however, includes an exception for transactions in which a contract is written before Jan. 1, even if the closing occurs in 2018. The bill passed by the House includes no such exception. Therefore, homeowners who are currently thinking about selling have only one month left to complete a deal before proposed tax changes would take effect. Should tax reform be enacted, some homeowners who sell in 2018 may no longer qualify for the capital gains exclusion, which covers up to $250,000 for an individual and $500,000 for a married couple. As a result, the difference between your client’s tax bill pre- and post-tax reform could be huge.
It won’t be known whether the House or Senate version of tax reform is adopted until the bill is finalized, which could happen in a few weeks. But sellers who haven’t lived in their house for more than five of the last eight years will want to act quickly regardless of the version that is approved.
______________________
Drew & Christine Morgan are REALTORS/NOTARY PUBLIC in Belmont, CA. with more than 20 years of experience in helping sellers and buyers in their community. As Diamond recipients, Drew and Christine are ranked in the top 50 RE/MAX agents nationwide and the top 3 in Northern California.They may be reached at (650) 508.1441 or emailed at info@morganhomes.com.
The information contained in this article is educational and intended for informational purposes only. It does not constitute real estate, tax or legal advice, nor does it substitute for advice specific to your situation. Always consult an appropriate professional familiar with your scenario
Before we head into the winter slow season for home sales, we’ll take a quick look back at Q3 home sales for Belmont, and the larger San Mateo County.
BELMONT & SAN MATEO COUNTY
HOME SALES—
Belmont had 78 new listings in Q3 as compared to 64 last year during the same period, and increase of 18%.
San Mateo County’s inventory of new listings dropped 6% YOY
INVENTORY/SALES—
Ironically, even with more new listings the inventory dropped 21% YOY. Why? Because sales increased 17% eliminating housing inventory.
SMC’S overall inventory also dropped—31% YOY, and sales dropped by 3.4%
DAYS ON MARKET (DOM) —
The time it took to sell a home in Belmont, on average, dropped from 16 days to 14
SMC Days on market dropped from 27 to 23
MEDIAN HOME PRICE
The median home price increased 12.7% YOY for Q3 for closed homes. When we compared the size of the homes selling in the two periods, there was statistically no difference, at 1784 ft² in 2016 and 1,748 ft² in 2017—so we made no adjustment for square footage interfering with the median home price swing. Note that Belmont it an all-time median home price point this October 2017.
San Mateo COUNTY’S MEDIAN HOME PRICE ROSE 9.5% YOY IN Q3
PERCENT RECEIVED
Belmont home seller’s eked out 4.4% more for their homes over their list price than last year during the same period.
In San Mateo County that number went up to 3.7% of asking
WRAP-UP
In every category in regards to home sale activity, Belmont outperformed and outpaced San Mateo County leading speculation that the peak for Belmont home values have not yet been reached.
Drew & Christine Morgan are REALTORS/NOTARY PUBLIC in Belmont, CA. with more than 20 years of experience in helping sellers and buyers in their community. As Diamond recipients, Drew and Christine are ranked in the top 50 RE/MAX agents nationwide and the top 3 in Northern California.They may be reached at (650) 508.1441 or emailed at info@morganhomes.com.
The information contained in this article is educational and intended for informational purposes only. It does not constitute real estate, tax or legal advice, nor does it substitute for advice specific to your situation. Always consult an appropriate professional familiar with your scenario
With unusually low home inventory levels, many buyers are feeling frustrated and overwhelmed at the prospect of ever getting their ideal home, or have first-hand experience at losing the home of their dreams in a bidding frenzy.
Yet not all homes sell for over their asking price. In fact many sell below. Granted, they may seem far and few between, but they are out there. In fact, so far in 2017, 25% of San Mateo County home sales sold for less than what the sellers were asking. Many wouldn’t think that’s true, and we’d be willing to bet that if asked, many would say that it’s a lot less, like 1%, but they’d be wrong. Perception is not always reality. The media’s constant coverage of how “crazy” the housing market is, has been drummed into the minds of buyers—and sellers. And the homes that people see closing well above the asking price, only serve to validate the overall impression that the market is overzealous. And that emboldens people’s impressions, but it’s more of an emotional response, than one of accuracy. It is however, what people talk about and what they remember.
We sold a home just last month at 534 Wellington Avenue to a buyer of ours. The sellers expected six offers and received none. We stepped in and delivered a full price offer and it was accepted. It’s the second lowest 3 bedroom sale in San Carlos on the west side this year.
One way to get a good deal is to focus on homes which have been initially overpriced. Any home which is still on the market after 14 days is probably one that will need a price reduction, or may be willing to take a lower offer. These are opportunities that buyers may want to focus on if the multiple bids are giving rise to second thoughts about buying a home.
As for timing the market, there are times of the year that homes get more attention and more multiple offers. We just went through that period—February, March, April and now May. A lot of “why” homes sell with more offers and at a higher percentage of the sellers asking price has to do with several factors.
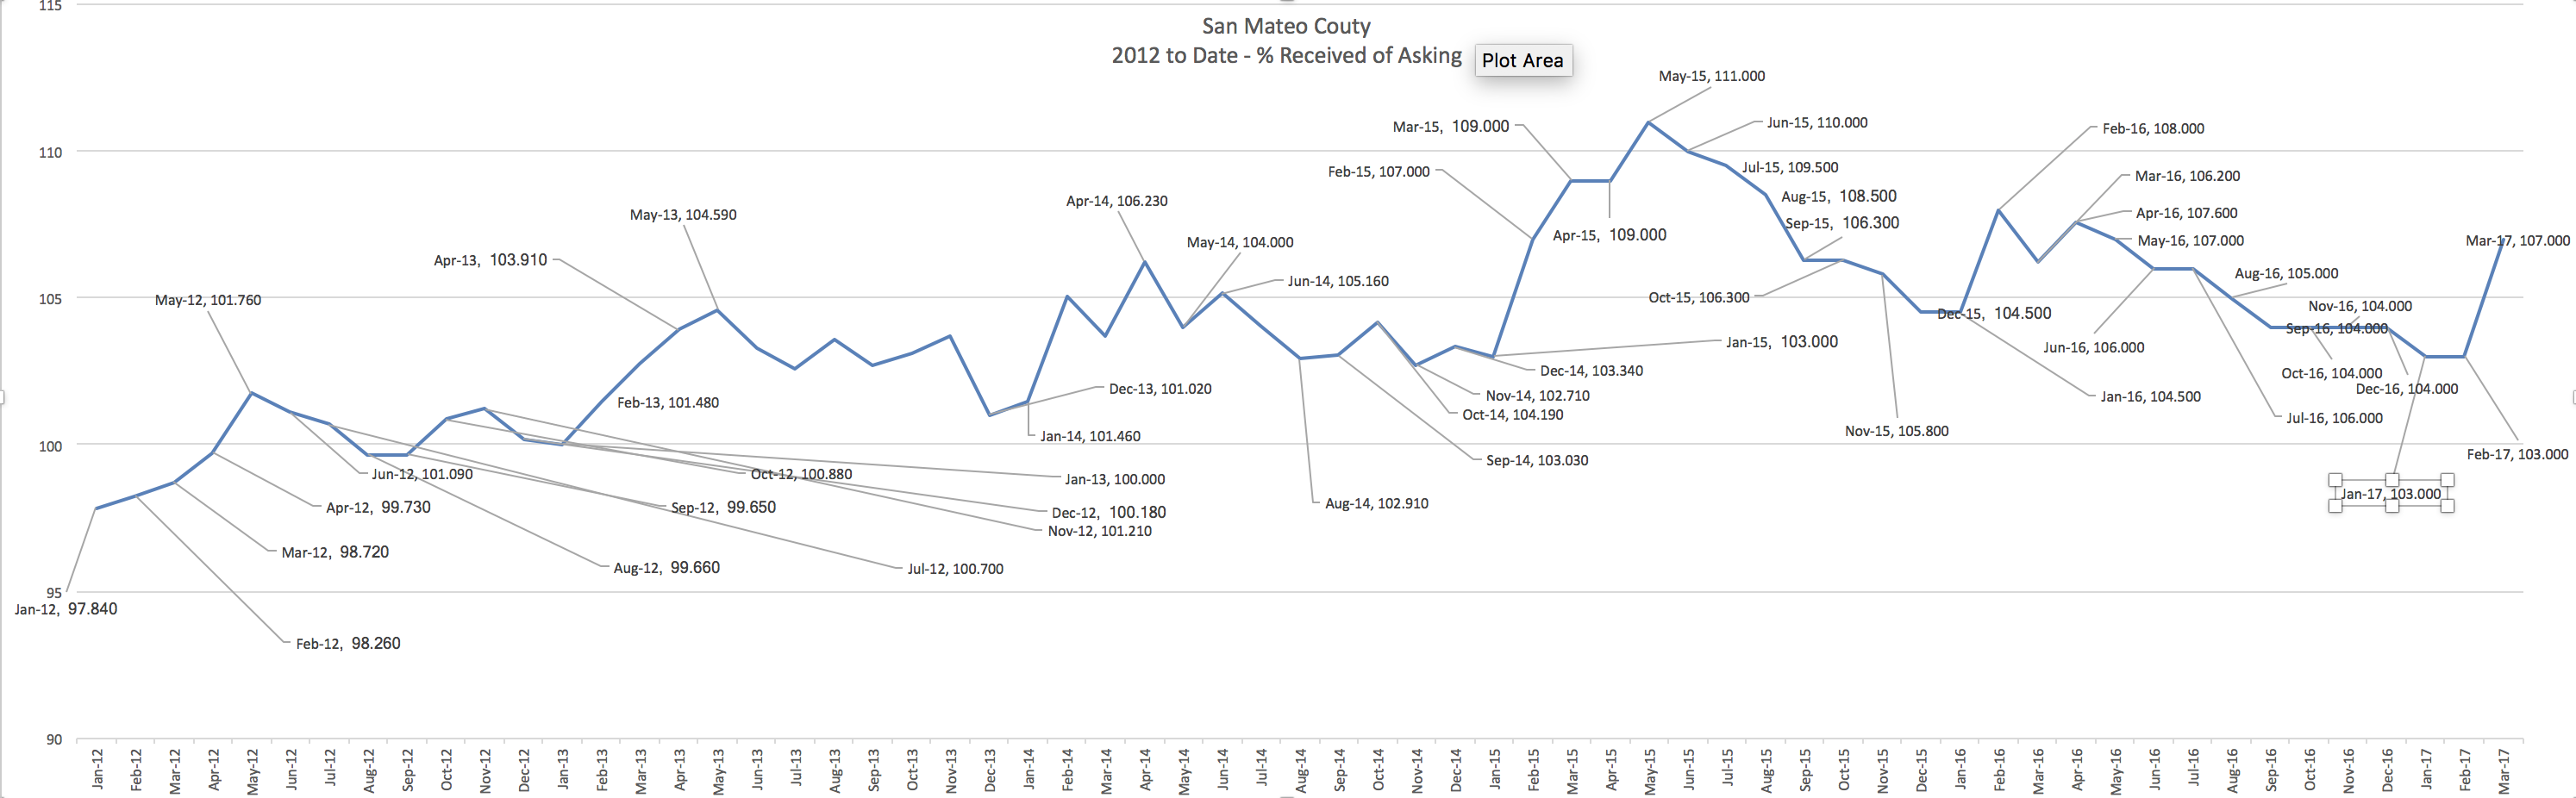
[Click on the graph below for a larger image]
As the new year begins, buyers and sellers are slow to come out of their market hibernation, but buyers seem to thaw out first. Many buyers have just received their end-of-year bonus, which they had been waiting for to jump into the housing market.
Some buyers with children are desperately trying to get a home in order to get their kids registered into a new school before the vacancies fill up—most first enrollment periods end within the first month or two of the start of the school year.
Another influence is that buyers who had lost out on homes in the prior year now focus more than ever on not losing out again, and they bid more aggressively than other buyers who may be just dipping their toes into the waters. And by June, these more aggressive buyers have all won—they have their home and the buyers that are left are the less aggressive buyers and overbids begin to wane. This typically happens around June, as this graph above of San Mateo County home sales since the turnaround in 2012 illustrates. It’s important to note however, that while the percentage a seller receives, and the number of overbids may be fewer, that doesn’t mean that prices decline. A high home price bar has already been established in the spring and it typically carries through until the end of the year. [Note: These statistics typically lag the market by a month—the typical escrow period. So a high sale percentage in May, was likely consummated in April].
Then of course there’s the competitive spirit. Buyers want what other buyers want and often a bidding frenzy ensues, pushing prices perhaps higher than they otherwise would be. It’s important to note that the aggressive buyer gets the home—the buyer that was willing to pay more than any other buyer at that moment in time. Did they overpay? Perhaps. But now they are a comparable sale for the next home, which invariably will sell for more, and so on and so forth until at the end of the year we have “appreciation”.
Drew & Christine Morgan are REALTORS/NOTARY PUBLIC in Belmont, CA. with more than 20 yearsofexperience in helping sellers and buyers in their community. As Diamond recipients, Drew and Christine are ranked in the top 50 RE/MAX agents nationwide and 3rd in Northern California. They may be reached at (650) 508.1441 or emailed at info@morganhomes.com.
The information contained in this article is educational and intended for informational purposes only. It does not constitute real estate, tax or legal advice, nor does it substitute for advice specific to your situation. Always consult an appropriate professional familiar with your scenario.
The California Association of REALTORS™ has released a recent report on the state of the California’s housing, naming San Mateo County as having the highest median price in the state. They went one to mention the rising number of new listings. Could this mean that sellers are finally thinking the market is near its top? Will housing inventory open up, and water down the tidal wave of multiple offers? It’s probably too soon in the year to tell, but the tide may be changing, as we commented on at the end of 2016.
• C.A.R.’s Unsold Inventory Index, which measures the number of months needed to sell the supply of homes on the market at the current sales rate, rose to 3.7 months in January from 2.6 months in December. The index stood at 4.3 months in January 2016.
• New listings in pricey Bay Area counties, such as Marin, San Francisco, San Mateo, and Santa Clara rose significantly from December, a possible indication of sellers cashing out robust price appreciation experienced over the past few years.
• New statewide active listings continued to decline, dipping 0.3 percent from December and 10.5 percent from January 2016.
• The median number of days it took to sell a single-family home went up from 33 days in December to 37 days in January but was down from 44.2 days in January 2016.
• C.A.R.’s sales-to-list price ratio* was 98.1 of listing prices statewide in January, 98.2 percent in December and 97.8 in January 2016.
• The average price per square foot** for an existing, single-family home statewide was $240 in January, $242 in December, and $228 in January 2016.
• San Francisco County had the highest price per square foot in January at $841/sq. ft., followed by San Mateo ($723/sq. ft.), and Santa Clara ($567/sq. ft.). Counties with the lowest price per square foot in January included Del Norte ($124/sq. ft.), Kings ($125/sq. ft.), and Kern ($127/sq. ft.).
• After mortgage rates surged in the final few weeks of 2016, the 30-year, fixed-mortgage interest rate averaged 4.15 percent in January, down from 4.2 percent in December but was up from 3.87 percent in January 2016, according to Freddie Mac. The five-year, adjustable-rate mortgage interest rates edged up in January to an average of 3.24 percent, from 3.23 percent in December and 2.98 percent in January 2016.
Reprinted with permission form the California Association of REALTORS®
Drew & Christine Morgan are REALTORS/NOTARY PUBLIC in Belmont, CA. with more than 20 years of experience in helping sellers and buyers in their community. They may be reached at (650) 508.1441 or emailed at info@morganhomes.com.
The information contained in this article is educational and intended for informational purposes only. It does not constitute real estate, tax or legal advice, nor does it substitute for advice specific to your situation. Always consult an appropriate professional familiar with your scenario.