Belmont Home Values Rise Again in June But Fall Short of Surrounding Cities

One would have to be living under a rock to be oblivious to the reports of the hot Bay Area housing market. The San Jose Mercury released the headline yesterday that in the nine Bay Area counties the median home price rose 33% year over year this June.

June of 2012 was about the time we were seeing strong signs of a housing rebound but it was still too early to declare with certainty that the rebound would last—that didn’t occur until November of 2012.

One might wonder if Belmont is under performing since home prices only rose 6% this June over last. There’s actually good news for Belmont homeowners in these statistics, here’s why:

One of the main reason that home values have skyrocketed year-over-year in the nine Bay Area counties is that many of the cities in these counties had home prices which felt to levels far below where any market correction should have predicted they would land. In other words, the hardest hit areas with the most drastic price reductions are seeing the largest percentage rebound. Since Belmont’s home values fared rather well during the downturn, our rebound is more sensible.

Don’t tell that to buyers who are trying to get their first home. They’re seeing bidding wars going on which in June of 2013 made the average home in Belmont sell for 112% of the initial asking price.

Belmont Home Values Rise
Click on the graphic for a full-size screen shot

SALES

Home sales in Belmont—contrary to the nine Bay Area County trend—picked up (albeit an insignificant amount).  June of 2012 saw one more home sale than last June with 27 homes closing escrow.

The only event that helped sales in June of 2013 was that in May we had a plethora of new listings—35. Year over year that was a strong seasonal influx of new listings.

INVENTORY

This new category we are adding to the monthly report is all about inventory—the number of homes available for purchase. We measure the inventory level and compare that to the number of monthly sales to arrive at a “Months of Inventory” statistic. The so-called months-supply is the number of months required to sell the current inventory of homes at the current rate of home sales. Our nation’s housing inventory is seeing levels in the 4-5 month range while Belmont’s inventory is less than one month’s worth—that’s a very tight housing inventory.

The housing inventory in June of 2012 stood at 39 homes for sale with 25 new listings hitting the market; contrasted to June of 2013 when there were only 19 homes to sell and 15 new listings. The good news that might save July’s statistics is the rally of new listings after the Fourth of July week that saw a listing hiatus.

MEDIAN HOME PRICE

The median home price in Belmont, as mentioned above, was a more sustainable 6% increase over last June at $1,113,500, the second highest median home price ever recorded for Belmont (October of 2007 it stood at $1,135,000).

SQUARE FOOT

We always look at the size of homes selling in the two periods to see if there is an inequity but with the difference between June of 2012 and June 2013 being a meager 55 square feet smaller in 2013, it’s statistically insignificant. Why? Because appraiser don’t even account for square foot difference of less than 100 square feet.

DOM (Days on the Market)

The time it took to sell the average home in Belmont dropped dramatically from 50 days last year to only 14 this June—a 72% decrease in the time it took to sell a home.

PRICE REDUCTIONS

Price reductions are another way to catch the pulse of the market. The more sellers who have to lower their asking price expectations in order to attract a buyer says more about buyer trepidation  than seller’s lofty and overzealous price expectations. In June of 2012 four of the 26 sellers lowered their asking price while this June only one seller suffered from that fate.

PRICE RECEIVED OF ASKING

The price a seller receives also tends to be a good indication of the strength of the market. In June of 2012 57% of the homes sold for more than the asking price with a list-sale price ratio of 103%. This June 88% of the homes sold for over the asking price for on average 112% of the initial asking price.

Interest rates are rising and how that will impact our local market is yet to be seen. Clearly it has knocked a few buyers and sellers off of the fence.  It’s anyone’s guess how our local market will react but intuitively we believe that the days of multiple offers in the double digit range may be waning.

Drew & Christine are local Belmont REALTORS® and homeowners with more than 20 years experience.

Drew & Christine Morgan
REALTORS | Notary Public
(650) 508-1441

Disclaimer:

The information contained in this article is educational and intended for informational purposes only. It does not constitute real estate, tax or legal advice, nor does it substitute for advice specific to your situation. Always consult an appropriate professional familiar with your scenario.

Drew & Christine Morgan did not necessarily participate in these sales.

Interest Rates Predicted to be 10% by Year’s End

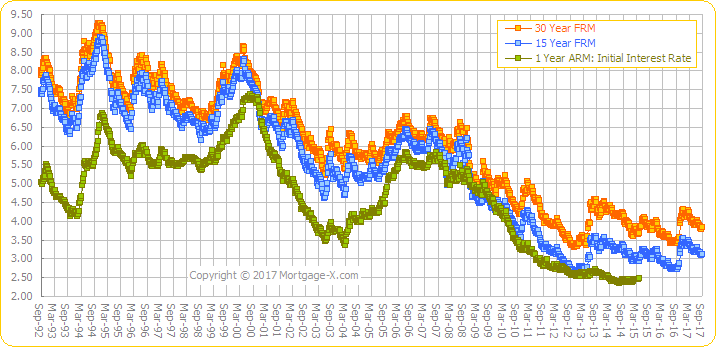
That could easily have been a headline ripped from the pages in major newspapers back in August of 1994 when rates were only 6%–yet by year’s end the prediction nearly came true as a mere four months later they would rise to almost 10%!

Are you old enough to remember what normal mortgage interest rates were like?

Interest Rates DropAccording to Bankrate.com, mortgage interest rates have been attractive for such a long stretch of time that many homebuyers and homeowners might not realize that rates haven’t always been this low. Mortgage interest rates in the 4-percent range were unheard of until 2010, and rates in the 5-percent range were unknown prior to 2003, according to Bankrate.com surveys through the years and a chart of monthly average mortgage interest rates tracked by the Federal Reserve since 1971.

Prior to 2003, higher mortgage interest rates were the norm. In the early 1970s, rates hovered in the 7-percent range and spiked up above 9 percent in late 1975, late 1976 and most of 1978. At the end of the decade and throughout the 1980s, mortgage interest rates rarely dipped lower than 10 percent.

In the early 1980s, mortgage interest rates brushed the stratospheric highs of 18 percent and even 19 percent. Imagine trying to get a home loan with an interest rate of 18 percent. At that rate, the mortgage interest deduction would be a very lucrative income tax perk, but the monthly payment on a loan would be far more painful than a typicalmortgage payment today.

During the 1990s, mortgage interest rates ranged from around 7 percent to roughly 9 percent for many years. It was only in 2000 that rates began to fall to earth. They held at less than 9 percent in 2000, less than 8 percent in 2001 and less than 7 percent in 2003.


Reproduced with the permission of Mortgage-X.com

If you’ve been putting off refinancing your home or buying a new one, don’t get lulled into inaction with the thought that these new low rates are here to stay.

The information
contained in this article is educational and intended for informational
purposes only. It does not constitute real estate, tax or legal advice, nor
does it substitute for advice specific to your situation. Always consult an
appropriate professional familiar with your scenario.


Drew & Christine
Morgan did not necessarily participate in these sales.

DRE License Numbers
01124318 & 01174047

Drew & Christine
Morgan, REALTORS | Notary Public


Saving More For A Down Payment–is it Wise?

Is it Wise to Save More For Your Down Payment?

Are you a first-time buyer wondering how you’ll ever have
enough of a down payment to buy your first home?

Do you wonder how much down payment you need for a home? Did
you know that if you’re buying a home and using FHA financing your down payment
could be as little as 3.5?. Ten percent down loans are also making a comeback
and are quite common once again.

But should you wait and save more for your down payment so
you can be 20% down? In our current market, that might not be such a great
idea.

Home values have been increasing rapidly in the last year.
An area in Belmont known as Sterling Downs offers many first time buyers
affordable living options. But the values there have been rising with the rest
of the tide.

This graph illustrates the price trend in the last year in
Sterling Downs, Belmont. We used homes which closed escrow since January of
last year that were three bedrooms and between 900 and 1,100 square feet so
that the sale prices weren’t affected by the size of homes selling.

Clearly it would be near impossible to keep up with the increase
in the selling prices simply by saving more money each month from your paycheck. We estimate
that in 2012 to date the average Sterling Downs home increased $75,000 or just over
$5,000 per month.

If you have been waiting to buy a home and need some advice
on some of the varying financing options which are available, feel free to contact us and
we’ll refer you to one of the great mortgage brokers who can answer all of your
questions.


Mortgage-rates27-300x300
The information
contained in this article is educational and intended for informational
purposes only. It does not constitute real estate, tax or legal advice, nor
does it substitute for advice specific to your situation. Always consult an
appropriate professional familiar with your scenario.


DRE License Numbers
01124318 & 01174047

Drew & Christine
Morgan, REALTORS | Notary Public

All data was retrieved
from MLS Listings, Inc. The Multiple Listing Service for San Mateo County.


Belmont Median Home Price Hits Record High

What’s up with this crazy market? The stock market hit an
all time high this week and our local housing prices are right in step. Pundits
say that our housing market tracks the S&P 500 and if they’re right, we’re
in for a heck of a ride.

Belmont housing prices continued to show gains into February
as Belmont had both month-to-month and year-over-year increases in the median
price—so let’s start there.

This graph shows the median price trend for the past year in
Belmont.


February 2013 for Belmont

[click on the image for a larger graph]

MEDIAN PRICE

The median home price in Belmont increased 42% last month
over a year ago. Belmont’s February home price reached $1,108,000. To put that
in perspective that is the second highest median home price for Belmont since we began tracking the market in 1998. The only other time it was this high was in
October of 2007—right before the housing crash hit the Peninsula.

If you’ve been following our market
update you know we never leave the raw numbers alone. Since Belmont has a relatively
small number of homes selling each month when a disproportionate number of
smaller or larger homes sell in a given month it impacts the median home price and
skews it off axis.

In order to adjust for this we look at the size of homes
selling in the two periods. Insofar as we know we are the only local experts
drilling down to this level of detailed analysis.

Homes which sold in February 2103 in Belmont were 20% larger
than they were in 2012 during the same period, so while the median increase in
price was 42%, could this mean the adjusted median home price gain was actually
closer to 22%?

Looking at it another way, the difference in the size of homes
selling in the two periods was 1,970 square feet in 2013 and 1640 square feet
in 2012—a difference of 330 square feet (20% increase this year). Now let’s
multiple that by the median price per square foot the homes sold for in 2012
and we get $181,500. If we add that to the median price in 2012 our adjusted
median home price for last year would be  $961,500—meaning that using this method for
adjusting the median home price we get a 15% increase year over year; and the
reality probably lies somewhere in between. Any way you slice it, 15-20% increase
year-over-year is an amazing rebound and this increase will hopefully create
more “equity sellers” and more seller’s with equity means more sellers who can sell which will in turn increase the housing supply.

One of the most impressive statistics is that only two homes had any price reduction at all and just as few sold for less than the seller’s asking price.

SALES

Sales were down this year over last so we checked the
inventory levels to try and understand why. In January of 2012 there were 21
new listings which hit the market. Adding to an already bloated inventory that
caused the inventory level last year in February to soar to 41 homes available
for sale. Contrasting that to this year when the new listings dropped 50% to
only 14 and our inventory of homes for sale stood at a paltry 12!

PERCENT OF ASKING

In February of 2012, seven of the 19 sales, or 37%, were for
more than the seller’s asking price by on average $46,000. This February 73% of
the sellers received on average $106,000 over their asking price.

For those sellers who were less fortunate, in 2012 53% sold their
home for on average $29,000 less while in 2013 only 18% had to sell for on
average $35,000 less.

The percent the sellers received of asking were 97.3% in
2012 as compared to 107.7 in 2013.

If you are considering selling your home the above statistics
might lead you to believe that it’s back to the old days when any agent could
put a sign out front and sell your home. And while that may be true—that your
home might sell—the percentage you actually receive of your asking price varies
relative to the degree of expertise in agent’s marketing plans and advice. If
you want to be statistically guaranteed that you’ll get the best results,
contact us for a consultation. Our record for selling every home we’ve listed,
for more money, and in the shortest period of time is unmatched—of the top
Belmont REALTORS, nobody has us beat.

If you are looking for someone to help you sell your home, we’re someone you should know.

The information contained in this article is educational and intended for informational purposes only. It does not constitute real estate, tax or legal advice, nor does it substitute for advice specific to your situation. Always consult an appropriate professional familiar with your scenario.

Drew & Christine Morgan did not necessarily participate in these sales.

DRE License Numbers 01124318 & 01174047

Drew & Christine Morgan, REALTORS | Notary Public

*All data was retrieved from MLS Listings, Inc. The Multiple Listing Service for San Mateo County.


Belmont’s Proposed Sewer Lateral Requirement Might Just Stink

Crocodile-in-the-sewer-urban-legends-231554_487_491

We initiated this post on the Belmont Patch and wanted to make sure the residents of Belmont know what their City Council is working on as the newest proposal in keeping Belmont’s residence safe.

I tend to stay away from expressing our opinions about the machinations of Belmont’s City Council but I thought their recent proposal which burdens every home seller with a sewer lateral inspection and repair requirement needs some public scrutiny.  

What is a sewer lateral?

It’s the underground pipe that runs from your home to the public sewer system.

What’s the issue?

In some cases, the sewer lateral can leak or even break causing sewage to seep into the ground—similar as to a leach field used in septic systems but not as sanitary. It also has the unwanted effect of possibly allowing ground water (from rain for example) to enter the sewer system which can overburden the system.

What’s the Fix?

First, you have to learn if you have a faulty sewer lateral. There is a relatively inexpensive smoke test which Belmont has been employing to detect faulty sewer laterals. The more expensive way to discover this is through a field test with a camera which is snaked through your sewer line to detect visible deficiencies.

How much does it cost if I need to repair my sewer lateral?

That depends. An short run and easy fix from your home to the street might cost under a thousand dollars but could also reach ten times that amount if there are difficulties in reaching the sewer lateral or, as in the case of many Belmont homes, the sewer lateral has a very extensive run across multiple properties before it reaches the main city sewer line.

What the City of Belmont is considering:

The Belmont City Council has been deliberating whether or not to force each homeowner to perform a test and if necessary repair the sewer lateral before they can sell their home. That proposal is called a “point of sale” or POS proposal.

What’s the problem with their proposal?

There are several issues with this approach which could cause a homeowner a problem should they need to sell their home and either not have the funds to repair the sewer lateral, or not have the time before the close of escrow. Amendments to this proposal include ways a homeowner could negotiate with a buyer to inherit the burden but so far the proposed workarounds appear to be at odds with lending and escrow institutional requirements.

What’s the answer?

The City of Belmont is currently testing sewer laterals utilizing a smoke test which offers the added benefit of detecting downspouts that may be discharging roof runoff into the sewer system rather than the storm drains. Should they find a leak they could then require the homeowner to repair their sewer lateral and have the opportunity to secure financing if needed.

The POS proposal seeks to limit the sewer lateral test to a relatively small subset of homes—only those which sell in a given year, which in 2012 was only 236—while the easily performed smoke test could potentially reach far more homes.

One wonders if the city is truly interested in fixing the sewer lateral problem or pushing it off onto those who will have little voice in the next election—those selling their home and moving away.

UPDATE–I attended the meeting with the Belmont staff and council on Thursday, the 14th to hear their newest idea of the Point of Sale requirement for sewer laterals. Be clear, the City Council has directed the staff to discuss how to best implement the POS, not whether or not the POS is the best way to deal with the issue.

Clearly there is a need to repair broken sewer lateral lines in our city. Having sewage seep into the surrounding ground is not ideal, but the larger problem appears to be the amount of water which enters broken sewer laterals during and after heavy rains. This water then ends up taxing an already overburdened treatment system and anyone who lives in Belmont knows the cost of maintaining our sewer system keeps getting passed along in the form of rate increases on our property tax bills.

But is it leaking water into our sewer laterals which is the major culprit or is it the city’s very own main lines? The smoke tests which the city has been performing clearly revealed one of the greatest issues are folks who have tied their downspouts into the sewer system rather than divert the water to run down the curb and into the storm drain. So again we question, are we moving forward armed with all of the information we need or just moving forward to give the impression we’re making progress?

The rainy season is almost over and we’d suggest the council, which appears ahead of their skis right now, take a step back and get more information and input before storming ahead. Gathering more information from lending institutions, title companies and plumbing contractors who specialize in sewer lateral replacement might prove to be a good start. Having the city deliver the results of their smoke testing to the public for scrutiny might also show some good faith that these decisions are based on solid data; then set a date for action prior to next years’ rainy season.

The question of course today is why a POS vs. requiring each property owner to test and fix their sewer laterals? If the City Council is truly concerned about fixing the issue, a POS requirement severs to only uncover a small percentage of the defective sever lateral lines—commensurate with home many homes sell each year. Since it’s an election year, this seems a politically palatable way to deliver bad news—only those moving would be affected by the cost (estimated to average $7,500 per household). But is it the best answer to the problem? Probably not.

If the council is truly concerned with the health and safety of its citizens it might continue down the path of requiring each and every homeowner to remedy this situation independent on whether or not they are moving. I’m struggling with this but the only reason I can see for not requiring every homeowner to repair their lateral is it would be politically unfavorable.

If the City Council has its way a POS would be eminent. The staff has been directed to develop a step-by-step plan for administrating this new burden. The proposal, if I can paraphrase it and as it stands now, is before a home could be transferred, it would need to have a certification the sewer lateral is intact. That encumbers the homeowner to order and pay for a sewer lateral camera inspection costing about $150-$200 dollars depending upon ease of access. The results of the test and camera footage shall be delivered to the public works department for analysis—promised not to take more than a day or two. If your sewer lateral passes, you get to pass “GO”. If not, you will be required to fix it and provide a certification to the city prior to the close of escrow. Of course the city will have its hand out for encroachment permits, building permits and so forth and they’ve offered no proposed relief on these fees in order for homeowners to comply. Or, the third option presented on Thursday, was that the buyer of the property could sign a pledge to repair the sewer later at their expense with 180 days of closing—and deliver a deposit as security of performance—an amount which has yet to be determined.

Of course this will raise all sorts of red flags for lenders, who if they get wind this requirement exists, will force the repair of the sewer lateral prior to the close of escrow as part of a lending requirement. So while we applaud the city staff for attempting a workaround, their third prong option still has some kinks in it. Namely that once the seller and buyer negotiate who will pay for this repair those negotiations will become part of the contract—the very contract the lender will scrutinize and thus require a sewer lateral certification before they will lend on the property.

As REALTORS, we’re used to handling city issues in the form of disclosure such as the new smoking ordinance, school boundary issue, or even dog and alarm licensing requirements so this newest burden which the city apparently feels we are fighting just for the sake of having to do less work, is really a non sequester for us. What this will burden is the home sale transaction—the seller and the buyer—to find a way to appease the city’s new requirement without unwittingly defrauding the lender at the same time.

The views expressed here are my own–Drew Morgan and not necesarily the views of the National Association of REALTORS, The California Association of REALTOS, The San Mateo Association of Realtors or even my wife.

Belmont Home Sales – November 2010

We love the holidays as much as anyone, but a little less red in the chart would be nice too.

Belmont home sales for November of 2010 continued the trend of the last two quarters with fewer sales and declining home values as compared to the same period in 2009. 

November 2010

(Click on the chart to see a full-sized image)

Clearly consumer confidence is woefully short of normal. While consumer confidence does not in and of itself control the direction of the economy it does reflect consumer sentiment. Consumer sentiment is well represented by consumer spending—when consumers are comfortable with their view of the future they tend to spend more. Considering that some estimate consumer spending to represent 2/3rds of our nation’s domestic product (GDP) suffice to say that consumer confidence is necessary for a sustained recovery. For consumer confidence to rebound there needs to be more jobs and of course the feeling that the job one has won’t go away soon either. On a positive note the consumer confidence index rose to 54.1 in November from a revised 49.9 in October. It was the highest level in five months. The index was benchmarked at 100 in 1985, a year chosen because it was neither a peak nor a trough in consumer confidence.

How does this affect the housing market? The tenuous job market is taking its toll on nervous home buyers. Buyers are still purchasing homes but fewer can qualify for a loan and when they do it’s usually for less home than before. Those who are willing to purchase a home seem to want only exceptional deals—building into their offer price a buffer against further price declines.

SALES

Home sales in Belmont remained fairly strong considering the aporetic feelings among buyers.

This November we saw 16 homes trade hands in Belmont as compared to 22 in 2009.

Of the 16 sales, six sold for on average $21,350 more than the seller’s asking price in 17 days, one sold at the asking price, and nine sold for on average $16,500 less and took 82 days to sell.

Six sellers also reduced the price they were originally asking  for their home by on average by $149,342, while last year there were only three homes which had price reductions during the same period and for on average only $13,590.

MEDIAN PRICE

The median price (on paper) went up 5.4% to $843,475 from November 2009 when it was $800,000. However, in 2009 the median size home which sold was only 1,558 square feet as compared to this November when the median size home sold was 1,920 square feet—a difference of 352 square feet. At the median price per square foot that homes sold for during November, $466 and the difference in the size home sold, 352 sq. ft. one could make an argument that if all things were equal (the same size home selling in the two periods) the adjusted price for 2009 would be closer to $964,032 ((352 Sq. Ft. x $466 per sq. ft. = $164,032) + $800,000) =$964,032. This allows us to estimate that home values dropped around 12.5% year over year in the month of November. How much the median price changed for the year as a whole is yet to be determined. Remember, just because homes dropped 12.5% in the month of November, earlier increases in the year can mean at year's end the median price could be up for down from the previous year.

It’s also interesting to note that although the median size home which sold in November of 2010 was much larger, only one home sold over the one million dollar mark as compared to three in 2009.


DAYS ON MARKET (DOM)

Not surprisingly it took more time to sell a home this year than last–on average 62 days—up dramatically from 38.5 days in November of 2009. One also must be cognizant that last November the first-time buyer tax credit was in effect which skewed the numbers in favor of more sales, selling faster, and for more.

When home values are dropping, the time it takes to sell a home typically increases as sellers often price their home based on recent past sales. But when home values are falling, recent sales were worth more. Eventually most sellers get the idea that they must get ahead of the pricing curve and lower their home more than the market suggests it might be worth. This has an ancillary effect of lowering home values rapidly and perhaps more than they would otherwise drop.

Noting the huge difference in not only the number of homes which had price reductions, but the steep adjustments that were made, illustrates the difficulty in pricing a home in a declining market and underscores the importance of introducing your home to the market at the right price.

Summary

There’s always some danger in looking at a small market sample such as Belmont with only 16 sales in a given month. Seasonal factors play heavily in the statistics which is why we choose to compare each month we examine to the same month a year before. However, it’s important to note that other factors can effect comparing these two periods. For example, last November the first-time buyer tax credit was expiring, causing many buyers to rush to the bargaining table. This increased competition for homes undoubtedly buoying the prices while increasing sales.

Our leading indicators of future market conditions indicate a gradual recovery in the housing sector.

  • The Institute for Supply Management reported that the monthly composite index of manufacturing activity fell slightly to 56.6 in November after reaching 56.9 in October. A reading above 50 signals expansion. It was the 16th straight month of expansion.
  • Total construction spending rose 0.7% to $802.3 billion in October, following a revised 0.7% increase in September. Economists had anticipated a drop of 0.4% in October.
  • The National Association of Realtors reported that its pending home sales index, a forward-looking indicator based on signed contracts, rose 10.4% in October after a 1.8% decrease in September.
  • The Institute for Supply Management reported that the monthly composite index of non-manufacturing activity rose to 55 in November from 54.3 in October. A reading above 50 signals expansion. It was the 11th straight month of expansion.

On a local level our professional staging company has reported to us that their orders for staged homes are booking up fast for January, indicating that Sellers are interested in getting a jump on the spring market.

If you are considering selling your home next year you may want to consider doing it sooner rather than later before inventory rises to levels which make price reductions necessary to attract Buyers.

If you are considering selling your current home and/or purchasing a new one be sure and contact us for your real estate needs.

Now for the inevitable disclaimer: The information contained in this newsletter is educational and intended for informational purposes only. It does not constitute real estate, tax or legal advice, nor does it substitute for advice specific to your situation. Always consult an appropriate professional familiar with your scenario.