

OPEN HOUSE SATURDAY AND SUNDAY APRIL 18th & 19th 2:00-4:00
5 Bedrooms | 3 Baths | 3,148 ft² | 7,000 ft² lot | $3,200,000
Perched above the Peninsula, this is not a home that whispers—it unfolds. Light, air, and horizon become part of the architecture, with sweeping views from the San Francisco Bay to Mt. Diablo, shifting from crisp morning clarity to a warm evening glow.
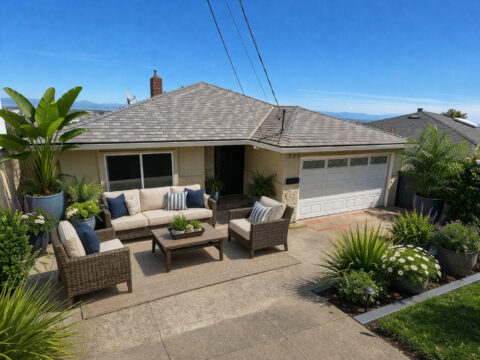
An inviting front patio entry creates a sense of arrival before the home reveals itself in a series of thoughtfully designed spaces. A gracious reception room offers a moment to pause, then opens to a grand living room where walls of glass frame cinematic views and draw the outdoors in.
The multi-level perimeter decking doesn’t simply wrap the home—it enhances the living experience. Each vantage point extenuates with views that evolve throughout the day, offering distinct settings for morning coffee, afternoon gatherings, and evenings under an open sky. A level rear yard with mature rose bushes offers a softer, more relaxed outdoor retreat.
Five generously proportioned bedrooms and three updated full baths, two private ensuites—one on the main level—provides flexibility for guests, extended living, or changing needs. The galley-style kitchen and dining area balance efficiency with warmth and features a KitchenAid® five-burner glass cooktop, Broan® Rangemaster stainless hood, GE® TrueTemp self-cleaning oven, LG® dishwasher, and GE®stainless French door refrigerator—all designed for reliable everyday performance.
Interior features include recessed lighting and real wood parquet flooring, adding texture and continuity. Additional amenities include a distinctive slate-style roof, a two-car attached garage and included washer/dryer. ADU potential on the lower level.
Moments from downtown San Carlos and Belmont, the location offers easy access to a vibrant mix of dining, shopping, commute routes and daily conveniences. With approximately 3,148 sq. ft. of living space on a 7,000 sq. ft. lot, it is also within the boundaries of Carlmont High, a California Distinguished School.
This home balances presence with practicality.
- Stunning views of the San Francisco Bay and Mt. Diablo
- Generous five bedrooms, including two ensuites
- Three updated full baths
- Multi-level perimeter decking with breathtaking views
- Enticing patio entrance
- Gracious reception room
- Grand living room with stunning views
- Galley-style kitchen adjacent dining room
- KitchenAid® Five-Burner glass stovetop
- GE® True Temp self-cleaning oven
- LG® Dishwasher
- GE® stainless French door refrigerator
- BROAN® Rangemaster stainless hood
- Recessed lighting
- Parquet hardwood flooring
- Large level rear yard area studded with mature rose bushes.
- Two-car attached garage
- Distinctive Slate-style roof
- Washer & Dryer included
- Close to downtown San Carlos and Belmont
- Inside Carlmont High boundaries
- Built in 1962
- Living area 3,148 sf (per appraisal)
- Lot Size, 7,000 sf (per County)
- ADU potential
