Bay Area Home Values Eclipse Historical Records

Case Shiller Report for June 2017

The Case-Shiller Report was released June 27th, the last Tuesday of the month, which tracks home sales in 20 metropolitan cities around the country, called MSA’s, of Metropolitan Statistical Areas.

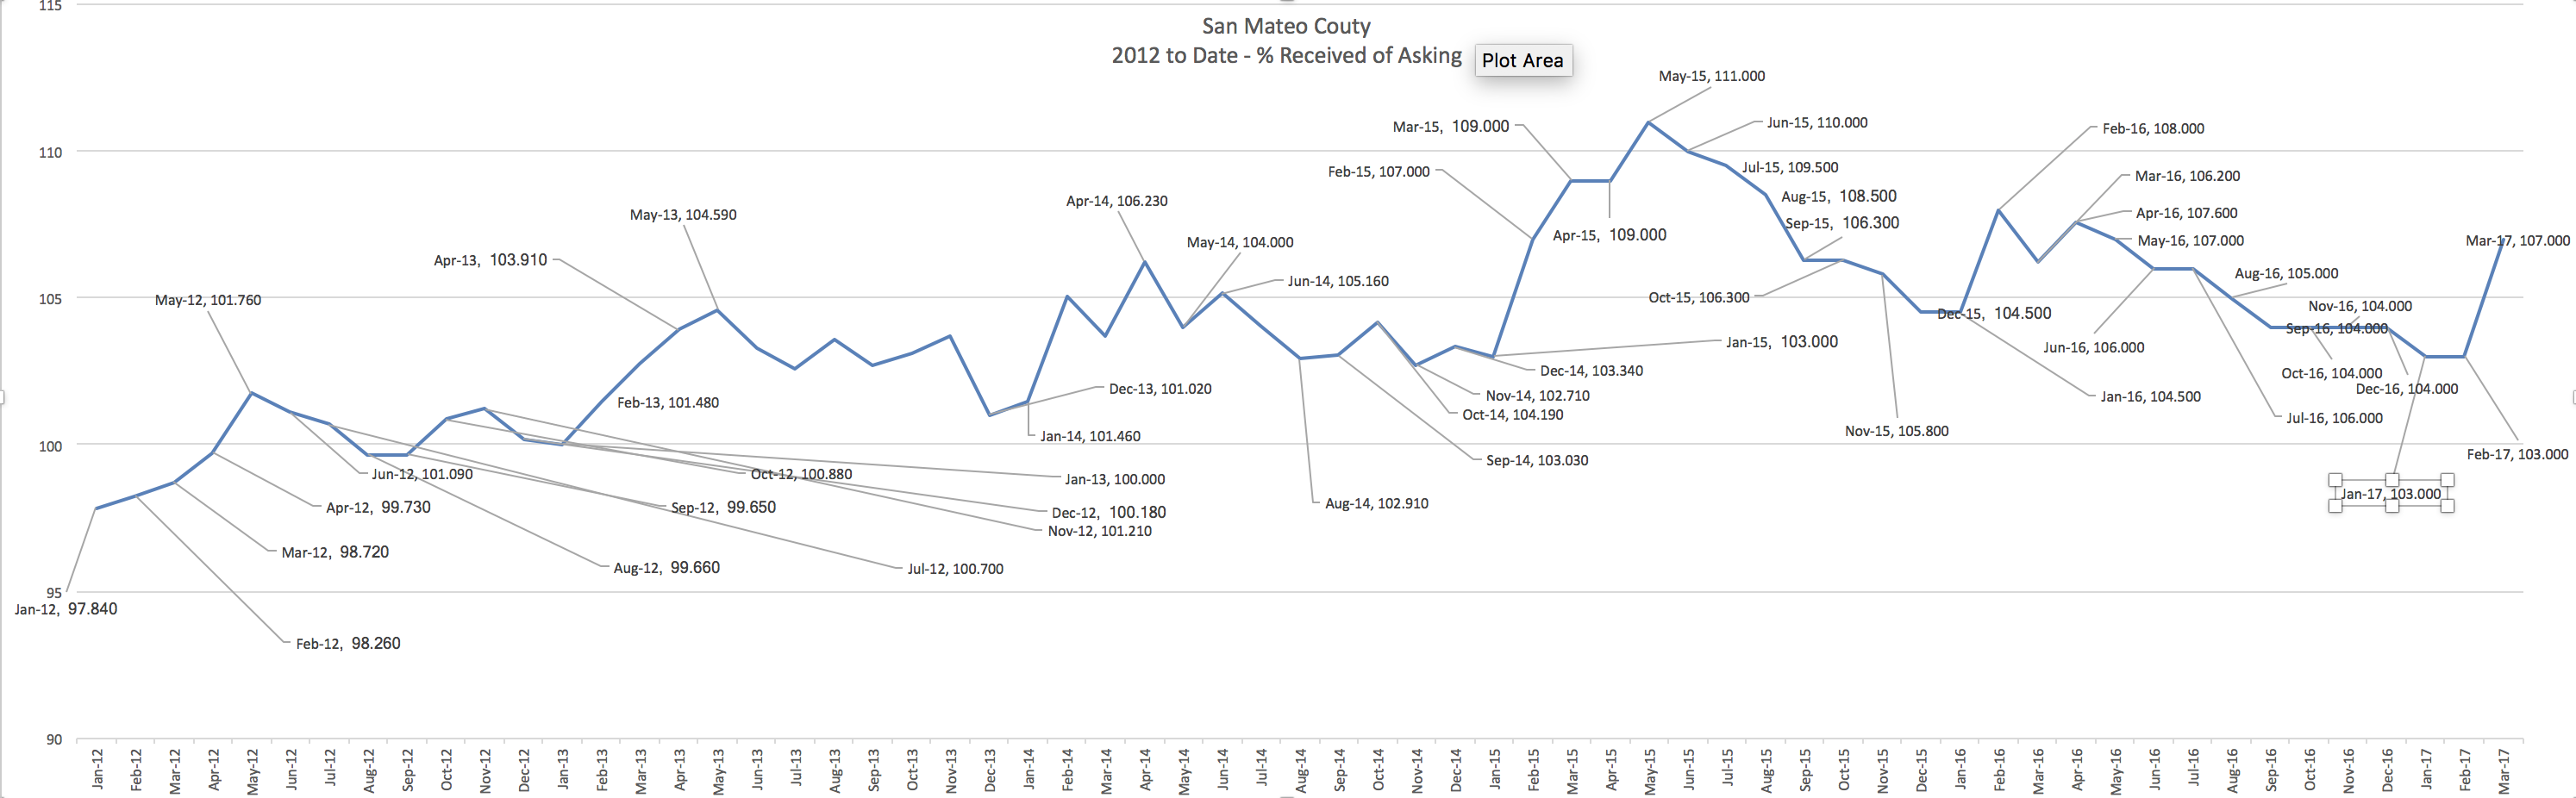
Our MSA (Metropolitan Statistical Area) in the Bay Area consist of five counties—Marin, San Francisco, San Mateo, Alameda and Contra Costsa. It’s important to note that while home values might be headed upward at a dramatic pace in the counties of San Francisco and San Mateo, they might be lagging in Alameda and Contra Costa, thus diluting the upward trend in one county vs. the whole MSA. This has been the case in our area since the housing recovery began in earnest in 2012.

The same goes for the 20 city composite index, which takes 20 metropolitan cities in the country and tracks them as an average trend.

While the 10 and 20 city composite indices shows that the housing market has not yet eclipsed the all-time high recorded around March of 2006, in the Bay Area, we have.

This graph which we built utilized the data from Case-Shiller for our SFMSA and illustrates that we have reached a new all-time high for home values. However, it’s important to note that the delta between the trend line and the peak where we are today, illustrating where the straight-line home values should be, is far less than in the peak of 2006, where we see a much great deviance off the trend line values. In fact, the peak of 2006 was 58% higher above the trend line than it is today.

One might infer from this that we are not as overvalued as it might appear at first glance.

This give some credence to the synopsis for the Standard and Poor’s Case-Schiller analysis and discussion.

Case-Shiller Analysis by Standard & Poor’s— ANALYSIS

Great View of San Francisco

“As home prices continue rising faster than inflation, two questions are being asked: why? And, could this be a bubble?” says David M. Blitzer Managing Director and Chairman of the Index Committee at S&P Dow Jones Indices. “Since demand is exceeding supply and financing is available, there is nothing right now to keep prices from going up. The increase in real, or inflation-adjusted, home prices in the last three years shows that demand is rising. At the same time, the supply of homes for sale has barely kept pace with demand and the inventory of new or existing homes for sale shrunk down to only a four- month supply. Adding to price pressures, mortgage rates remain close to 4% and affordability is not a significant issue.

“The question is not if home prices can climb without any limit; they can’t. Rather, will home price gains gently slow or will they crash and take the economy down with them? For the moment, conditions appear favorable for avoiding a crash. Housing starts are trending higher and rising prices may encourage some homeowners to sell. Moreover, mortgage default rates are low and household debt levels are manageable. Total mortgage debt outstanding is $14.4 trillion, about $400 billion below the record set in 2008. Any increase in mortgage interest rates would dampen demand. Household finances should be able to weather a fairly large price drop.”

Drew & Christine Morgan are REALTORS/NOTARY PUBLIC in Belmont, CA. with more than 20 years of experience in helping sellers and buyers in their community. As Diamond recipients, Drew and Christine are ranked in the top 50 RE/MAX agents nationwide and the top 3 in Northern California.  They may be reached at (650) 508.1441 or emailed at info@morganhomes.com.

For all you need to know about Belmont, subscribe to this blog right here. You can also follow us on Facebook at https://www.facebook.com/Morganhomes and on Twitter @ https://twitter.com/morganhomes

The information contained in this article is educational and intended for informational purposes only. It does not constitute real estate, tax or legal advice, nor does it substitute for advice specific to your situation. Always consult an appropriate professional familiar with your scenario


How Much Should I Bid to Win the Home?

How Much Should I Bid to Win the Home? You’ve found the ideal home, and now it’s time to make that offer. The offer to beat the other five offers you hear the sellers may be receiving.

When trying to determine an offer price, where do you start, or stop? Of course, your agent should be armed with the recent sales in the area to help you understand at what price the home you’re interested in could sell for.

Remember that in most cases, the buyer that was willing to pay more for the home than any other buyer is the one that typically wins the bid. So, you can forget about saying you don’t want to overpay in this market. By definition, if you won the home in a multiple bidding situation, you probably overpaid. But relax, now your home will be the sales comparable for the next buyers, that likely will now have to pay more than you did. Think of it to some degree like musical chairs, get your home before the music stops. The sooner you get into an appreciating market, the sooner you get to begin enjoying the appreciation, instead of bidding against it.

How to Set a Fair Price

Deciding what to offer can be a nail biting experience. You don’t want to lose the home, but you also don’t want to be blindly bidding against yourself. How much is too much? When you can’t afford anymore is one good threshold. But assuming you’ve looked at what the market bears for like properties, it’s likely that you’ll already know where you think the home should sell. So, pick a price and stick to it. Ask yourself, at what price am I willing to let go of this home? That way, if you win the bid, you’ll be happy and if you lose, you’ll at least know that going any higher just didn’t make sense. Remember, you have to sleep at night so you’ll have to live with whatever decision you make—choose wisely, and remember, sometimes you just have to let a home go if you are up against an overzealous buyer.
How Much Does the Home Need to Appraise For?

Lenders typically want you to put down 20% to have some skin in the game so to speak. Though as lending trends are beginning to loosen, some 10% loans are available.

Let’s say the offer you are going to make on the home you like is for $1,000,000. If you were putting down 20% that would be a $200,000 down payment and the lender would put up the remaining $800,000. Now the home must appraise for full value-—$1,000,000, as the lender will only lend 80% of wherever the home appraises. And that’s what makes sellers nervous—especially if your offer price is a new high water mark for the neighborhood. But if you could put down 25%, the home would only need to appraise for $937,500, giving both you and the seller some breathing room and peace of mind.

Here’s how the calculation works:

“X” = ((Offer price – Down Payment) ÷ .8) or (80%)
Where “X” is what the home must appraise for given the Down Payment.

So in our above example,

$1,000,000 — $250,000 = (25%)= ($750,000 ÷ 80% ) = $937,500.


We also wrote an article about Contingencies, which explains what happens when a home doesn’t appraise


Drew & Christine Morgan are REALTORS/NOTARY PUBLIC in Belmont, CA. with more than 20 years of experience in helping sellers and buyers in their community. As Diamond recipients, Drew and Christine are ranked in the top 50 RE/MAX agents nationwide and the top 3 in Northern California  They may be reached at (650) 508.1441 or emailed at info@morganhomes.com.

For all you need to know about Belmont, subscribe to this blog right here. You can also follow us on Facebook at https://www.facebook.com/Morganhomesand on Twitter @ https://twitter.com/morganhomes

The information contained in this article is educational and intended for informational purposes only. It does not constitute real estate, tax or legal advice, nor does it substitute for advice specific to your situation. Always consult an appropriate professional familiar with your scenario

Will There Be an End to Home Bidding Wars?

With unusually low home inventory levels, many buyers are feeling frustrated and overwhelmed at the prospect of ever getting their ideal home, or have first-hand experience at losing the home of their dreams in a bidding frenzy.

Yet not all homes sell for over their asking price. In fact many sell below. Granted, they may seem far and few between, but they are out there. In fact, so far in 2017, 25% of San Mateo County home sales sold for less than what the sellers were asking. Many wouldn’t think that’s true, and we’d be willing to bet that if asked, many would say that it’s a lot less, like 1%, but they’d be wrong. Perception is not always reality. The media’s constant coverage of how “crazy” the housing market is, has been drummed into the minds of buyers—and sellers. And the homes that people see closing well above the asking price, only serve to validate the overall impression that the market is overzealous. And that emboldens people’s impressions, but it’s more of an emotional response, than one of accuracy. It is however, what people talk about and what they remember.

We sold a home just last month at 534 Wellington Avenue to a buyer of ours. The sellers expected six offers and received none. We stepped in and delivered a full price offer and it was accepted. It’s the second lowest 3 bedroom sale in San Carlos on the west side this year.

One way to get a good deal is to focus on homes which have been initially overpriced. Any home which is still on the market after 14 days is probably one that will need a price reduction, or may be willing to take a lower offer. These are opportunities that buyers may want to focus on if the multiple bids are giving rise to second thoughts about buying a home.

As for timing the market, there are times of the year that homes get more attention and more multiple offers. We just went through that period—February, March, April and now May. A lot of “why” homes sell with more offers and at a higher percentage of the sellers asking price has to do with several factors.

[Click on the graph below for a larger image]


As the new year begins, buyers and sellers are slow to come out of their market hibernation, but buyers seem to thaw out first. Many buyers have just received their end-of-year bonus, which they had been waiting for to jump into the housing market.

Some buyers with children are desperately trying to get a home in order to get their kids registered into a new school before the vacancies fill up—most first enrollment periods end within the first month or two of the start of the school year.

Another influence is that buyers who had lost out on homes in the prior year now focus more than ever on not losing out again, and they bid more aggressively than other buyers who may be just dipping their toes into the waters. And by June, these more aggressive buyers have all won—they have their home and the buyers that are left are the less aggressive buyers and overbids begin to wane. This typically happens around June, as this graph above of San Mateo County home sales since the turnaround in 2012 illustrates. It’s important to note however, that while the percentage a seller receives, and the number of overbids may be fewer, that doesn’t mean that prices decline. A high home price bar has already been established in the spring and it typically carries through until the end of the year. [Note: These statistics typically lag the market by a month—the typical escrow period. So a high sale percentage in May, was likely consummated in April].

Then of course there’s the competitive spirit. Buyers want what other buyers want and often a bidding frenzy ensues, pushing prices perhaps higher than they otherwise would be. It’s important to note that the aggressive buyer gets the home—the buyer that was willing to pay more than any other buyer at that moment in time. Did they overpay? Perhaps. But now they are a comparable sale for the next home, which invariably will sell for more, and so on and so forth until at the end of the year we have “appreciation”.

Drew & Christine Morgan are REALTORS/NOTARY PUBLIC in Belmont, CA. with more than 20 years of experience in helping sellers and buyers in their community. As Diamond recipients, Drew and Christine are ranked in the top 50 RE/MAX agents nationwide and 3rd in Northern California. They may be reached at (650) 508.1441 or emailed at info@morganhomes.com.

For all you need to know about Belmont, subscribe to this blog right here. You can also follow us on Facebook at https://www.facebook.com/Morganhomesand on Twitter @ https://twitter.com/morganhomes

The information contained in this article is educational and intended for informational purposes only. It does not constitute real estate, tax or legal advice, nor does it substitute for advice specific to your situation. Always consult an appropriate professional familiar with your scenario.


Why a Buyer Representaion Agreement Could Help You

How to decide if committing to one real estate agent is important, or should you “play the field”. We wanted to take a moment to explain a bit more about the Buyer Represention agreement, why we use one, and why it is important to you as well.

Most agents will attempt to work with 20-30 prospective buyers at a time in the hope that one will purchase a home through them—that’s an outdated model. We take a more focused approach. We work with no more than two buyers at a time in order to provide a heightened level of service. We’re not here to just set you up on an automated email list for homes—you can do that on your own. We set ourselves apart by taking proactive steps in finding you the ideal home. We meet and discuss each week to find new off market opportunities for our clients. And if you’re a client, we can even door knock and direct mail to targeted neighborhoods to find you a motivated seller.

Networking to uncover off-market opportunities is our main focus during your home search. With the advanced search engines available on the internet, everyone has access to the public
inventory. We try and uncover homes to which otherwise you would not have access.

Initially, we like to tour several homes in various areas with our clients to understand their wants and needs first-hand. This is a valuable aspect of the process, since we use this information when we go to work locating properties which are good fit for our clients.

But even focusing on working with just two buyers, it’s impossible for us to be showing homes every weekend to our clients (we also work Monday through Friday trying to find off-market properties and previewing homes).

This is why open houses are a great way for you to visit homes at your leisure. If you zero in a perspective home, that’s when we make an appointment to show you the home in private and uninterrupted. We employ our many years of visiting and following inspectors around properties to help put the deficiencies in the inspection reports into perspective.  We’ll tell you if we wouldn’t buy a particular home, and we can do that because we’re confident that at some point, we will find you the ideal home.

Would you want your agent to pressure you into buying a home, out of fear they may lose you to another agent? Or rest assured knowing that your best interest is always first and foremost.

This is just one of the important reasons that as a buyer, you should want to have an agreement in place.

Another reason to work with an agreement, is to distinguish yourself from a customer and become a client. And the difference is whether or not you are committed to the relationship with an agreement. A “Customer” does not enjoy the same legal protections that are afforded a “Client”. Many agents will work strictly with customers, because they are desperate to land a sale. The last thing you should want is a desperate agent trying to find you a home.

And then there’s the practicality of with whom we decide to work. As a client, you are privy to our “Pocket” of off-market listing. These are of course reserved for those with whom we have a relationship of mutual respect and trusMutal Agreementt.

The agreement also protects us against the threat of “procuring cause”. You see, when you walk into an open house, that agent could lay claim to you as the procuring cause of locating the home, and we may be excluded from representing you. These cases of procuring cause actions typically involve a hearing or even a lawsuit to unravel. But the issue you will encounter is that you will no longer have your own representation. In this situation, if you want to buy that home, you may be forced to work with the seller’s agent. When this occurs, Dual Agency representation exists and the agent can no longer advise you on how to proceed with an offer, but rather becomes an “order taker”—we’re willing to bet that’s not the kind of assistance you want when purchasing perhaps your largest investment ever.

Lastly, imagine your own employment situation. Would you go to work everyday wondering if you’ll ever be fairly compensated for your work? We assume enough risk as it is, as many buyers change their minds and never purchase a home.

We hope that this will shed some clarity on why a written working understanding is important to a mutually respective relationship.

Drew & Christine Morgan are REALTORS/NOTARY PUBLIC in Belmont, CA. with more than 3

Drew and Christine Morgan are experienced REALTORS and NOTARY PUBLIC located in Belmont, CA. They have been assisting buyers and sellers in their community for over 30 years. Drew and Christine have received the coveted Diamond award and ranked among the top 50 agents nationwide and top 3 in Northern California by RE/MAX. To contact them, please call (650) 508.1441 or email info@morganhomes.com.

For all you need to know about Belmont, subscribe to this blog right here. You can also follow us on Facebook and on Twitter.

This article provides educational information and is intended for informational purposes only. It should not be considered as real estate, tax, insurance, or legal advice, and it cannot replace advice tailored to your specific situation. It’s always best to seek guidance from a professional who is familiar with your scenario.

0 years of experience in helping sellers and buyers in their community. As Diamond recipients, Drew and Christine are ranked in the top 50 RE/MAX agents nationwide. They may be reached at (650) 508.1441 or emailed at info@morganhomes.com.

For all you need to know about Belmont, subscribe to this blog right here. You can also follow us on Facebook at https://www.facebook.com/Morganhomesand on Twitter @ https://twitter.com/morganhomes

The information contained in this article is educational and intended for informational purposes only. It does not constitute real estate, tax or legal advice, nor does it substitute for advice specific to your situation. Always consult an appropriate professional familiar with your scenario.


New Listings in Pricey Bay Area Counties Rose Significantly

The California Association of REALTORS™  has released a recent report on the state of the California’s housing, naming San Mateo County as having the highest median price in the state. They went one to mention the rising number of new listings. Could this mean that sellers are finally thinking the market is near its top? Will housing inventory open up, and water down the tidal wave of multiple offers? It’s probably too soon in the year to tell, but the tide may be changing, as we commented on at the end of 2016.

• C.A.R.’s Unsold Inventory Index, which measures the number of months needed to sell the supply of homes on the market at the current sales rate, rose to 3.7 months in January from 2.6 months in December. The index stood at 4.3 months in January 2016.

• New listings in pricey Bay Area counties, such as Marin, San Francisco, San Mateo, and Santa Clara rose significantly from December, a possible indication of sellers cashing out robust price appreciation experienced over the past few years.

• New statewide active listings continued to decline, dipping 0.3 percent from December and 10.5 percent from January 2016.

• The median number of days it took to sell a single-family home went up from 33 days in December to 37 days in January but was down from 44.2 days in January 2016.

• C.A.R.’s sales-to-list price ratio* was 98.1 of listing prices statewide in January, 98.2 percent in December and 97.8 in January 2016.

• The average price per square foot** for an existing, single-family home statewide was $240 in January, $242 in December, and $228 in January 2016.
• San Francisco County had the highest price per square foot in January at $841/sq. ft., followed by San Mateo ($723/sq. ft.), and Santa Clara ($567/sq. ft.). Counties with the lowest price per square foot in January included Del Norte ($124/sq. ft.), Kings ($125/sq. ft.), and Kern ($127/sq. ft.).

• After mortgage rates surged in the final few weeks of 2016, the 30-year, fixed-mortgage interest rate averaged 4.15 percent in January, down from 4.2 percent in December but was up from 3.87 percent in January 2016, according to Freddie Mac. The five-year, adjustable-rate mortgage interest rates edged up in January to an average of 3.24 percent, from 3.23 percent in December and 2.98 percent in January 2016.

Reprinted with permission form the California Association of REALTORS®

_____________________________________________________________________________________

Drew & Christine Morgan are REALTORS/NOTARY PUBLIC in Belmont, CA. with more than 20 years of experience in helping sellers and buyers in their community. They may be reached at (650) 508.1441 or emailed at info@morganhomes.com.

For all you need to know about Belmont, subscribe to this blog right here. You can also follow us on Facebook at https://www.facebook.com/Morganhomesand on Twitter @ https://twitter.com/morganhomes

The information contained in this article is educational and intended for informational purposes only. It does not constitute real estate, tax or legal advice, nor does it substitute for advice specific to your situation. Always consult an appropriate professional familiar with your scenario.

Cell Phone Photos Should Be Banned

If a picture is worth a thousand words, then what does an awful picture say?

Putting your home’s best foot forward is of paramount importance to get the positive attention you want when selling your home.

Nikon-Cameras
If you stop and think about the role that advertising plays in our culture, one can easily see why it’s important that your home’s advertising is top notch—after all, there’s a reason the top 200 advertisers in the United States collectively, spent a record $137.8 billion on advertising in 2014, up 2% year on year, according to Ad Age’s annual “200 Leading National Advertisers” report, advertising works!

Let’s take just one aspect of the marketing for your home—the photos.

The idea behind photographs in on-line marketing, is to entice potential buyers to come and physically see your home. The photos should be of high quality and resolution and be taken by a professional. The days of using your own camera are gone. So, should the use of cell phones, yet we still see this atrocious practice employed even in our sophisticated market.

The old saying, “If you don’t have anything nice to say, don’t say anything at all”, applies equally to photography. Remember, photos are a vehicle to get people to visit your home, not scare them away. Too much information can be as detrimental as none at all. A professional photographer typically knows the difference, but not always, so we’re still vigilant about filtering out only the shots that best represent a home.

We’ve seen some amazing work by seasoned agents who should clearly know better.

This is one of our favorites. It was on the market for 21 days and yet the agents never took the time to straighten the photo.90 Degree Home


In this photo, we can see the agent never even visited the home. They simply took a screen shot of a Google Map (the directional arrow is clearly visible in the photo).

Screen Shot 2017-01-23 at 11.39.00 AM


But there are less obvious infractions, like crooked photos, over or under exposed shots and even small minutia like leaving a toilet seat up when shooting the bathroom.

Agent in Mirror

Here’s a home where the agent
took her own photos. Not only were all of them crooked, in this photo of the bathroom she can be seen standing in the mirror with a washed -out flash.


When Photoshop Works Wonders3344 El Sobrante

Let’s face it, the weather doesn’t always cooperate on the day of a shoot. For this home in San Mateo we recently sold, the day came for photographs and the sky was ominously dark. The driveway also had streaks from rain water running down to the street. Here you can see what a few minutes of Photoshop can do to remedy a problem.


When interviewing an agent to sell your home, it’s best to see examples of their work. Avoid the dangers of Adverse Selection and asymmetric information by doing an on-line search for their work in its entirety, not just the examples they’re willing to share.

Drew & Christine Morgan are REALTORS/NOTARY PUBLIC in Belmont, CA. with more than 20 years of experience in helping sellers and buyers in their community. They may be reached at (650) 508.1441 or emailed at info@morganhomes.com.

For all you need to know about Belmont, subscribe to this blog right here. You can also follow us on Facebook at https://www.facebook.com/Morganhomesand on Twitter @ https://twitter.com/morganhomes

The information contained in this article is educational and intended for informational purposes only. It does not constitute real estate, tax or legal advice, nor does it substitute for advice specific to your situation. Always consult an appropriate professional familiar with your scenario.


Housing May Be Approaching Equilibrium

A lot transpires at the end of the year. There are resolutions for the new year, and reflection upon the year just passed. There’s wrapping up the holiday decorations and reflecting upon the celebratory memories.

And then there’s wrapping up the year-end business for us. Surveying what happened in our local housing market and taking a stab at the “Why”?

We posted an article for our blog in December which we authored and was originally printed in the Examiner. It was aptly titled, “Shifting Market in Play”. In it, we discussed the subtle but noticeable shift in our housing market towards a market approaching equilibrium—that being a market wherein the demand is nearing the supply. That’s a good thing, as a more normal market is a more sustainable market.

It’s not simply that demand for housing is waning, but rather demand at the newly established price point is down. In other words, fewer people can afford the median price home which has had a dampening effect on home sales.

Affordability is affected by three major factors: median house price, mortgage interest rates, and household income. Mortgage rates are still below historical averages, and household income is on the rise. So, what is keeping housing affordability down are home prices—which are ironically artificially inflated due to the first two factors, low interest rates and high income.

Comparing the year-end numbers for Belmont, we see that listings were up but sales were down. The time it took to sell a home was higher, but the price the sellers received and the percent of the seller’s asking price were lower.

2016-2017 YOY Data


The median price appears to have taken a hit too, but upon further examination, one can see that while the median price was down 1.5%, the median size home that sold last year was down even more, at 3.4%.

When the housing market dropped in 2007, home values bounced along at the bottom for several years before climbing again. This is typically true at the peak as well. Are we there? We could be. Data from Q1 & Q2 will give us a more clear picture.

Drew & Christine Morgan are REALTORS/NOTARY PUBLIC in Belmont, CA. with more than 25 years of experience in helping sellers and buyers in their community. They may be reached at (650) 508.1441 or emailed at info@morganhomes.com.

For all you need to know about Belmont, subscribe to this blog right here. You can also follow us on Facebook at https://www.facebook.com/Morganhomesand on Twitter @ https://twitter.com/morganhomes

The information contained in this article is educational and intended for informational purposes only. It does not constitute real estate, tax or legal advice, nor does it substitute for advice specific to your situation. Always consult an appropriate professional familiar with your scenario.


Shifting Market in Play

NOTE: Shifting Market in Play is an article we did for the Examiner in December, when asked to comment on 2016—A Year in Review: This is a link to the original article.

In order to understand our current housing market, one must appreciate that markets are constantly in flux. In our town of Belmont, we looked at home sales and compared the periods from January thru November for years 2015 and 2016.

Let’s first discuss the market conditions. There’s a lot of hyperbole as to the state of our current housing market. Sellers are still in the mindset that they hold all of the cards, yet buyers are beginning to push back on prices. Sellers are receiving fewer offers, many have had to lower their asking prices, and homes are often times closing below the asking price—something that rarely happened from 2012-2015. This suggests a shifting market.

Clearly, the sky is not falling, the shift is towards a more normal market, where homes sit on the market longer, and may sell above, at, or below the seller’s asking price. This long awaited market shift is not a correction, but rather a predictable and healthy move towards a more balanced and sustainable market. To be blunt, prices have risen to a level at which the majority of buyers can no longer afford the median priced home, resulting in a cooling down effect on the housing market.

We first examined all of the home sales in Belmont that occurred in 2015 through November in order to compare those with the same period of home sales in 2016. We added no search filter other than the date range, since the larger the pool of sales, the more reliable the data.

2015 2016 % ∆
Sales 178 181 1.7%
Median Home Price $1,516,500 $1,389,000 -8.4%
Home ft² 1850 1760 -4.9%
$/ft² 830 856 3.1%
DOM (Days on market) 12 11 -8.3%
% Received 114.5 107.2 -6.4%
Price Reductions 9 19 111.1%
For How Much $120,638 $118,477 -1.8%
Sold Over Asking 156 149 -4.5%
Sold At Asking 6 10 66.7%
Sold Under Asking 16 22 37.5%


It’s clear that a market shift has occurred. Note that the median home price reflects a significant decrease year over year (YOY), and part of that is simply because smaller homes sold in 2016 skewing the numbers. But in almost every category there’s a distinct shift towards a more normal market. There were fewer homes selling for more than the asking price and the ones that did sell over asking sold for 33% less over asking than in 2015. There were more cancelled listings, and more price reductions for greater amounts. The inventory of homes for sale is growing—up from 0.3 to 0.7 months of inventory (still considered seller’s territory).

On a more macro-level, when we look at the San Francisco Metropolitan Statistical Area (SFMSA) as produced by Case-Shiller for Standard and Poor’s, which encompasses the counties of Marin, Alameda, Contra Costa, San Francisco and San Mateo, one can see that while the YOY increase in their index was a rise of almost 15%, there was only a nominal 0.5% increase in home values since April.

How long will the new normal market continue? We’ll save that wild card question for other talking heads. Nobody really knows of course, and anybody that professes to know should give you cause for concern. However, the market appears to have hit a price threshold. As fewer buyers can qualify for the median priced home, more sellers will be getting less windfall profits like they did during the meteoric rise over the last three years.

Drew & Christine Morgan are REALTORS/NOTARY PUBLIC in Belmont, CA with RE/MAX Star Propeties. with more than 20 years of experience in helping sellers and buyers in their community. They may be reached at (650) 508.1441 or emailed at info@morganhomes.com.

For all you need to know about Belmont, subscribe to this blog right here. You can also follow us on Facebook at https://www.facebook.com/Morganhomes and on Twitter @ https://twitter.com/morganhomes

The information contained in this article is educational and intended for informational purposes only. It does not constitute real estate, tax or legal advice, nor does it substitute for advice specific to your situation. Always consult an appropriate professional familiar with your scenario.

The Eleventh Hour on the Eleventh Day of the Eleventh Month—Where Will You Be?

The Eleventh Hour on the Eleventh Day of the Eleventh Month—Where Will You Be?

Veterans Day originated as “Armistice Day” on Nov. 11, 1919, the first anniversary of the end of World War I. Armistice is an agreement made by opposing sides in a war to stop fighting for a certain time— a truce.

Congress passed a resolution in 1926 for an annual observance, and Nov. 11 became a national holiday beginning in 1938.Veterans Day

Veterans Day is not to be confused with Memorial Day–a common misunderstanding, according to the U.S. Department of Veterans Affairs. Memorial Day (the fourth Monday in May) honors American service members who died in service to their country or as a result of injuries incurred during battle, while Veterans Day pays tribute to all American veterans–living or dead–but especially gives thanks to living veterans who served their country honorably during war or peacetime.

  • In 1954, President Eisenhower officially changed the name of the holiday from Armistice Day to Veterans Day.
  • In 1968, the Uniform Holidays Bill was passed by Congress, which moved the celebration of Veterans Day to the fourth Monday in October. The law went into effect in 1971, but in 1975 President Ford returned Veterans Day to November 11, due to the important historical significance of the date.
  • Britain, France, Australia and Canada also commemorate the veterans of World Wars I and II on or near November 11th: Canada has Remembrance Day, while Britain has Remembrance Sunday (the second Sunday of November). In Europe, Britain and the Commonwealth countries it is common to observe two minutes of silence at the eleventh hour on the eleventh day of the eleventh month.

_____________________________________________________________________________________

Drew & Christine Morgan are REALTORS/NOTARY PUBLIC in Belmont, CA. with more than 20 years of experience in helping sellers and buyers in their community. They may be reached at (650) 508.1441 or emailed at info@morganhomes.com.

For all you need to know about Belmont, subscribe to this blog right here. You can also follow us on Facebook at https://www.facebook.com/Morganhomes and on Twitter @ https://twitter.com/morganhomes

The information contained in this article is educational and intended for informational purposes only. It does not constitute real estate, tax or legal advice, nor does it substitute for advice specific to your situation. Always consult an appropriate professional familiar with your scenario.


Local Housing Market Shows Signs of Change

BELMONT (AND BAY AREA) MARKET SHIFT

In order to know what changed in our housing market, one must understand that markets are constantly in flux, it’s just hard to see when you are in the middle of one—sort of like being in the eye of a hurricane. We looked at home sales in Belmont and compared the periods from January to September for 2015 and 2016. We’re always asked what’s going on in our market and we like to be armed with facts.

Most people want to know if the housing market is in the seller’s or buyer’s favor-if prices are going up, steady, or dropping. Buyers want to know as they are trying to decide if they should wait and see what happens with the market, or just move forward with life’s plans.

Anecdotally, many agents will tell you their opinion based upon their personal observations. If they had a hard time selling their last home they might tell you the market is “changing” and if their last listing flew off the shelf they might proclaim the housing market to be as robust as ever. But whatever people feel, the numbers don’t lie. They are an unemotional representation of what is occurring in a given market.

Let’s first discuss the market conditions. There’s a lot of hyperbole as to the state of our current housing market. Sellers are still in the mindset that they hold all of the cards, yet buyers are beginning to push back on prices. Sellers are receiving fewer offers, many have had to lower their asking prices, and homes are often times closing below the asking price—something that rarely happened from 2012-2015. This would suggest a shifting market.

Clearly, the sky is not falling, the shift is towards a more normal market, where homes sit on the market longer, and may sell above, at, or below the seller’s asking price. This long awaited market shift is not a correction, but rather a predictable and healthy move towards a more balanced and sustainable market. To be blunt, prices have risen to a level that the majority of buyers can no longer afford.

We first examined all of the home sales in Belmont that occurred in 2015 through August 31st in order to compare with the same period in 2016. We added no search filter other than the date range, since the larger the pool of sales, the more reliable the data.

Here are the data:belmont-analysuis-for-10-2016

We added an arrow to represent if the numbers went up or down as compared to 2015, and then rated with a “Thumb’s Up” icon for those parameters that showed little change or improved a bit over 2015.

Note that while the raw median home price dropped in 2016, you can see at the very bottom of this inset that we made an adjustment, since smaller homes sold in 2016 of the two periods we examined. So for example, although the size of homes which sold were 4.8% smaller in 2016, they only sold for 1.2% less. Could that be interpreted that the median price actually rose 3.6%? Our numerical calculation based upon price per square foot comes up with 1.5%. In either case, it’s a modest increase year over year at best.

On a macro-level, when we look at the San Francisco Metropolitan Statistical Area (SFMSA) as produced by Case-Shiller for Standard and Poor’s, which encompasses the counties of Marin, Alameda, Contra Costa, San Francisco and San Mateo, one can see that there was a nominal 1% increase in home values between May and June alone. This lends more credence to our theory that home values are initially topping out in higher priced areas like the Mid- Peninsula.

It’s clear that a market shift has occurred. While the median home price reflects a marginal change year over year (YOY), in almost every category there’s a distinct shift towards a more normal market. There were fewer homes selling for more than the asking price and the ones that did sell over asking sold for 30% less than in 2015. There were more cancelled listings, and more price reductions for greater amounts. The inventory of homes for sale is growing—up from 0.3 to 0.7 months of inventory (still considered seller’s territory).

The month’s supply of inventory is the measure of how many months it would take for the current inventory of homes on the market to sell, given the current pace of home sales. For example, if there are 50 homes on the market and 10 homes selling each month, there is a 5-month supply of homes for sale. The months of supply are a good indicator of whether a particular real estate market is favoring buyers or sellers. Typically, a market that favors sellers has less than 3 months of supply, while more than 6 months of supply indicates an excess of homes for sale that favors buyers.

Belmont still has less than one month of housing inventory but Foster City, also on the Mid-Peninsula, is currently running a housing inventory level of 3 months. What this means is that the market shift will no doubt continue until there’s a full blown correction. We could be years away from that happening, but we appear to be moving in that direction and we’re also moving into the slowest part of the season (winter), when seller’s typically net the least for their homes. In addition, if interest rates rise—and they should since they are at historic lows—that too will have a damping effect on home values in the near future.

How long will the new normal market continue? We’ll save that wild card question for other talking heads. Nobody really knows of course, and anybody that professes to know should scare you. However, the market appears to have hit a price threshold. As fewer and fewer buyers can qualify for the median priced home, more sellers will be getting less windfall profits like they did during the meteoric rise over the last three years.

Drew & Christine Morgan are REALTORS/NOTARY PUBLIC in Belmont, CA. with more than 20 years of experience in helping sellers and buyers in their community. They may be reached at (650) 508.1441.

The information contained in this article is educational and intended for informational purposes only. It does not constitute real estate, tax or legal advice, nor does it substitute for advice specific to your situation. Always consult an appropriate professional familiar with your scenario.