Belmont Home Value’s Increase—Is There No End in Sight?

Before we head into the winter slow season for home sales, we’ll take a quick look back at Q3 home sales for Belmont, and the larger San Mateo County.

BELMONT & SAN MATEO COUNTY

HOME SALES—

Belmont had 78 new listings in Q3 as compared to 64 last year during the same period, and increase of 18%.

San Mateo County’s inventory of new listings dropped 6% YOY

INVENTORY/SALES—

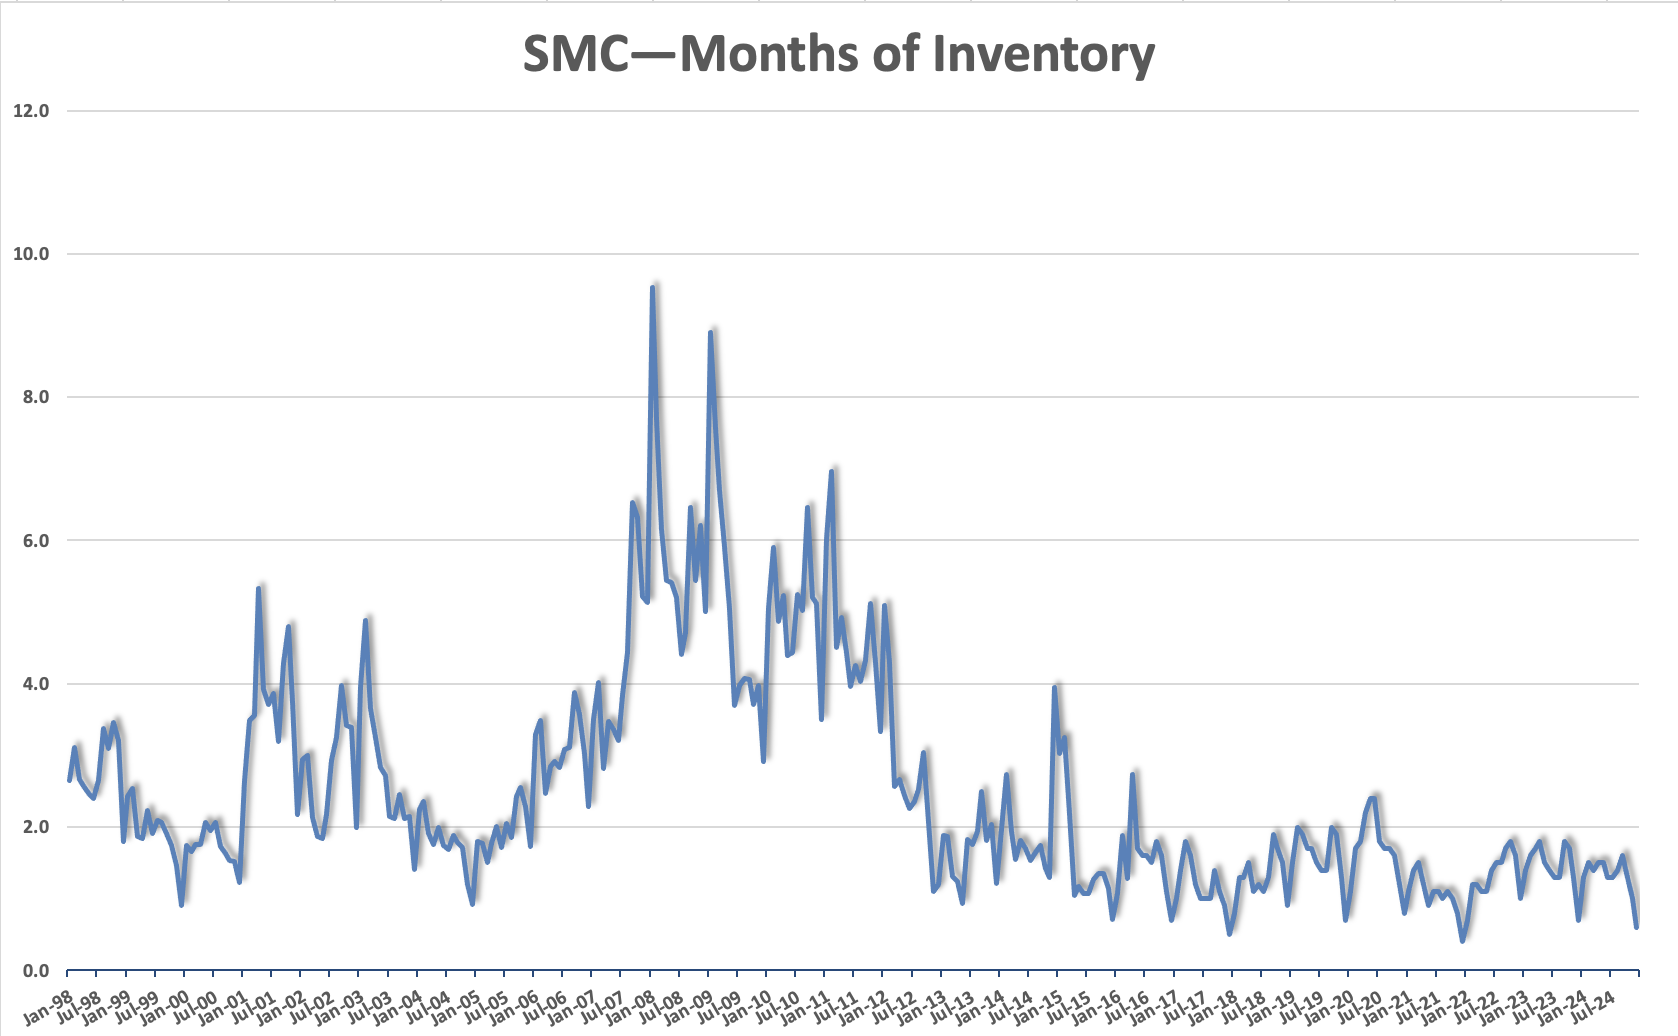
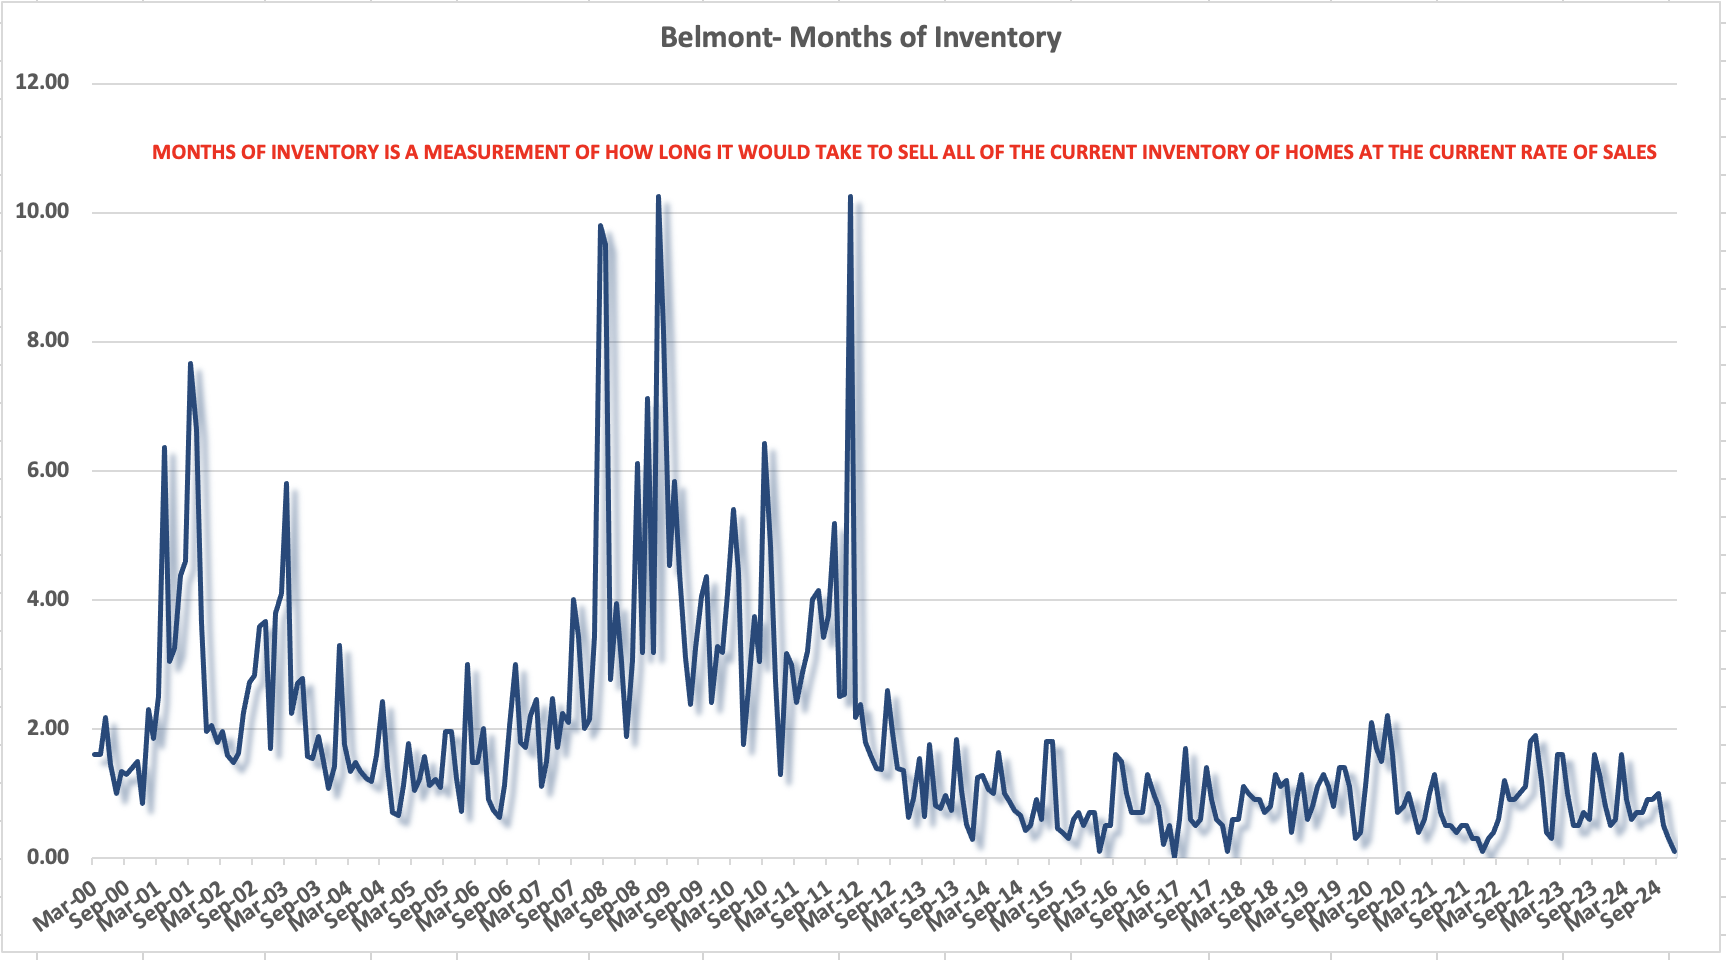
Ironically, even with more new listings the inventory dropped 21% YOY. Why? Because sales increased 17% eliminating housing inventory.

SMC’S overall inventory also dropped—31% YOY, and sales dropped by 3.4%

DAYS ON MARKET (DOM) —

The time it took to sell a home in Belmont, on average, dropped from 16 days to 14

SMC Days on market dropped from 27 to 23

MEDIAN HOME PRICE

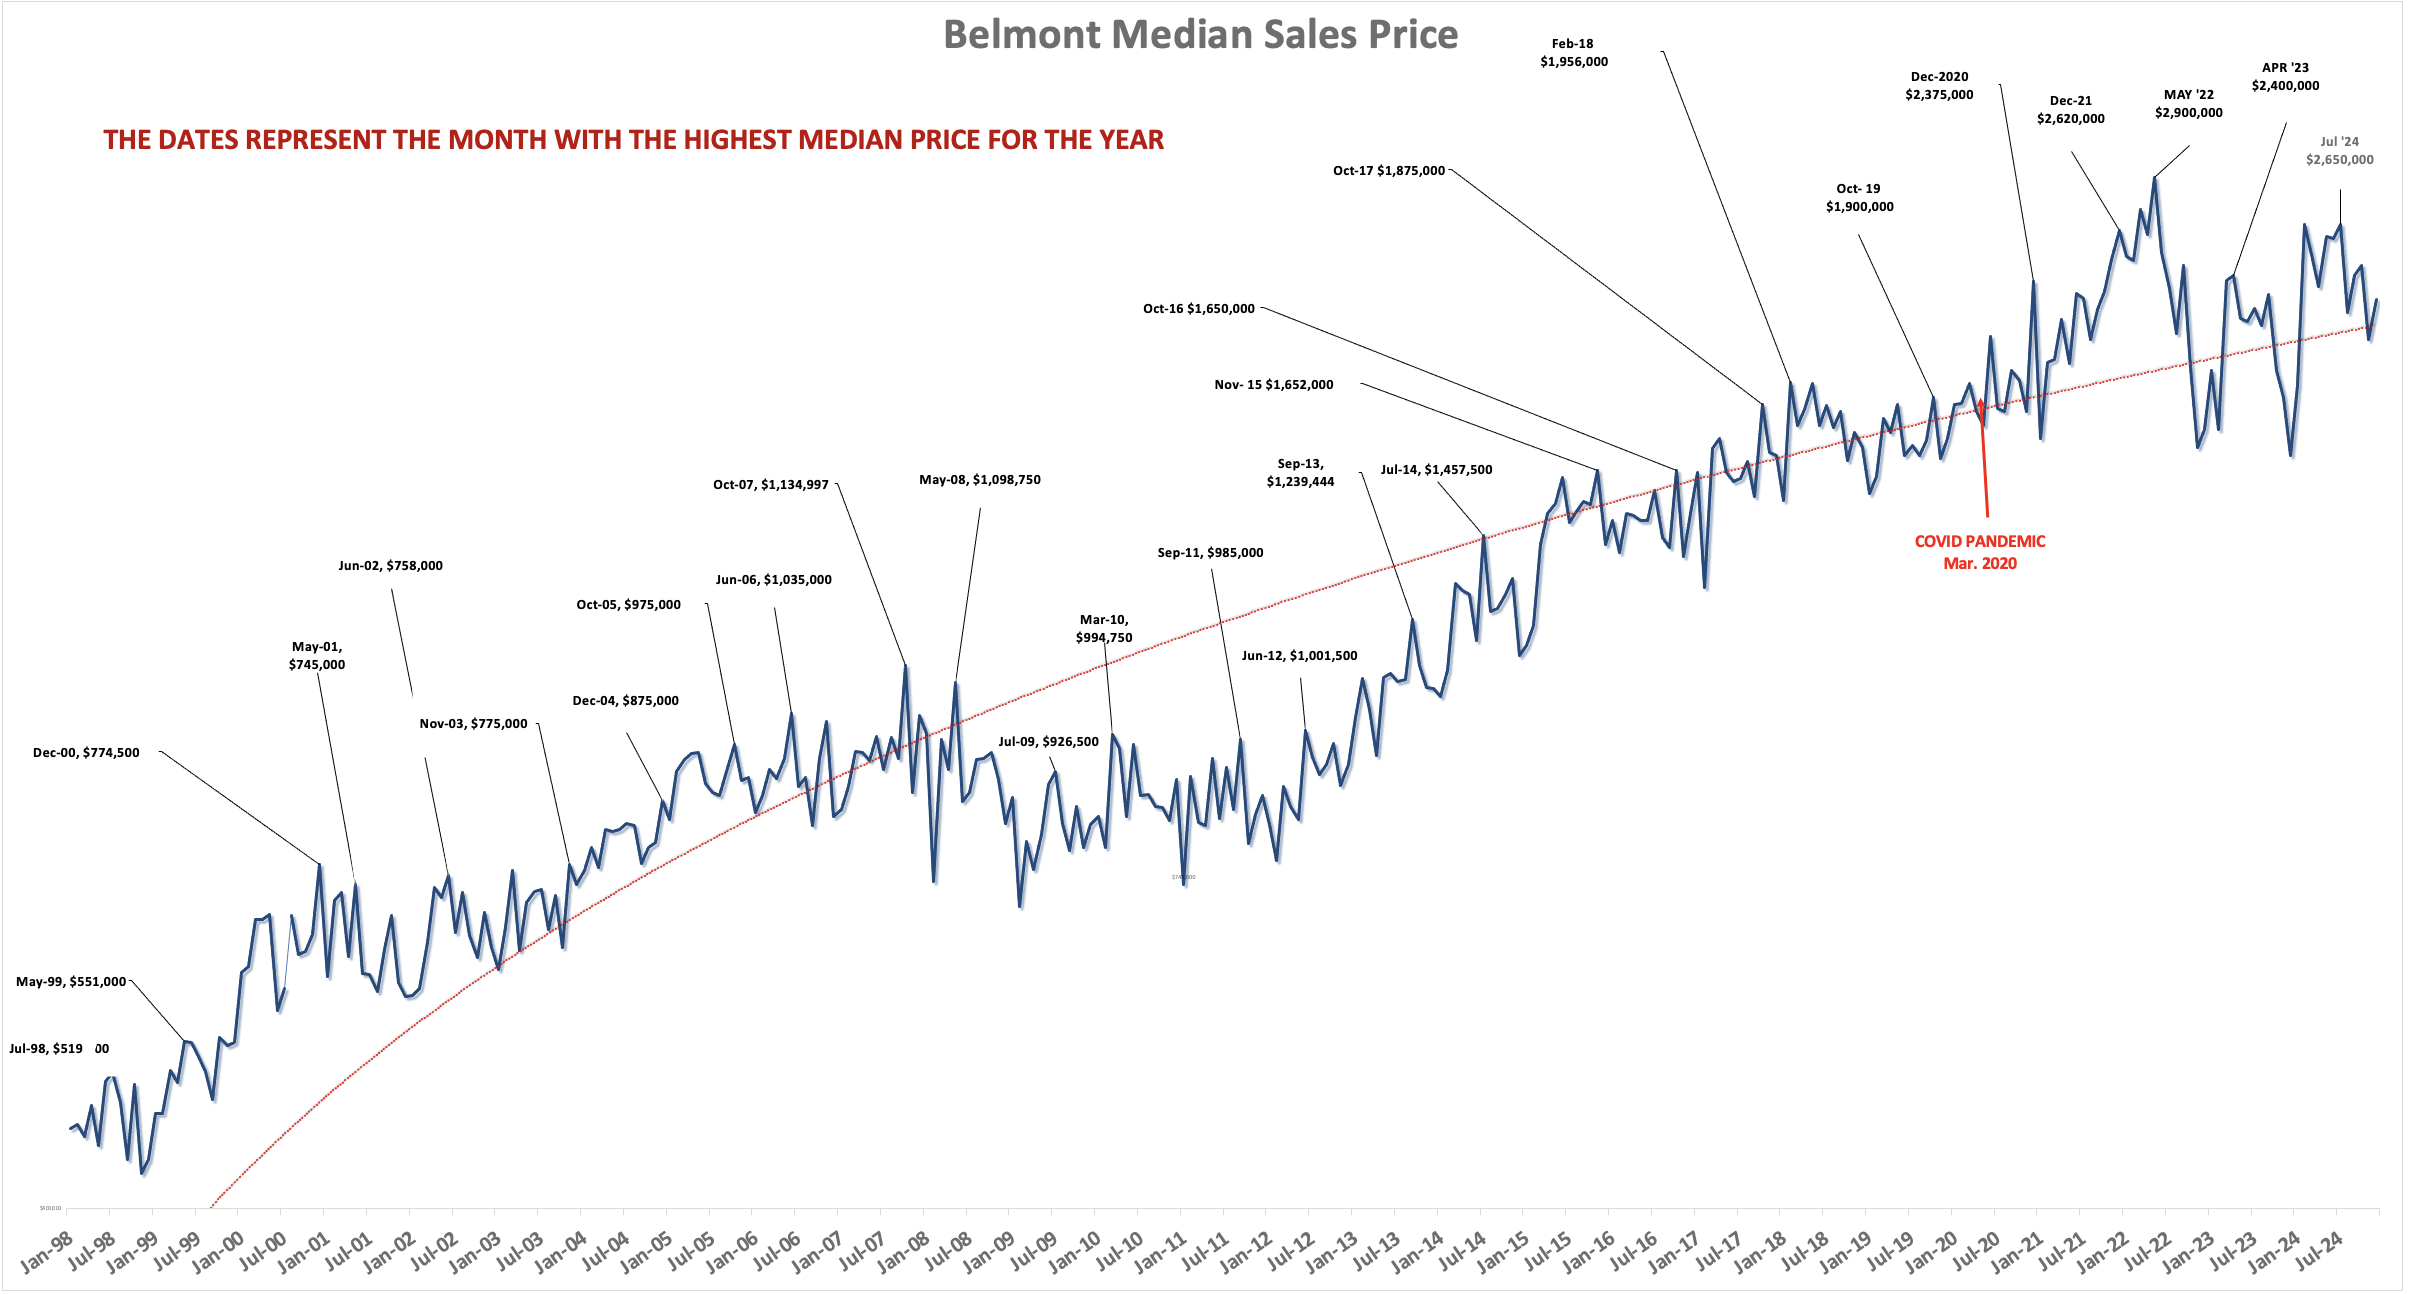
The median home price increased 12.7% YOY for Q3 for closed homes. When we compared the size of the homes selling in the two periods, there was statistically no difference, at 1784 ft² in 2016 and 1,748 ft² in 2017—so we made no adjustment for square footage interfering with the median home price swing. Note that Belmont it an all-time median home price point this October 2017.

San Mateo COUNTY’S MEDIAN HOME PRICE ROSE 9.5% YOY IN Q3

PERCENT RECEIVED

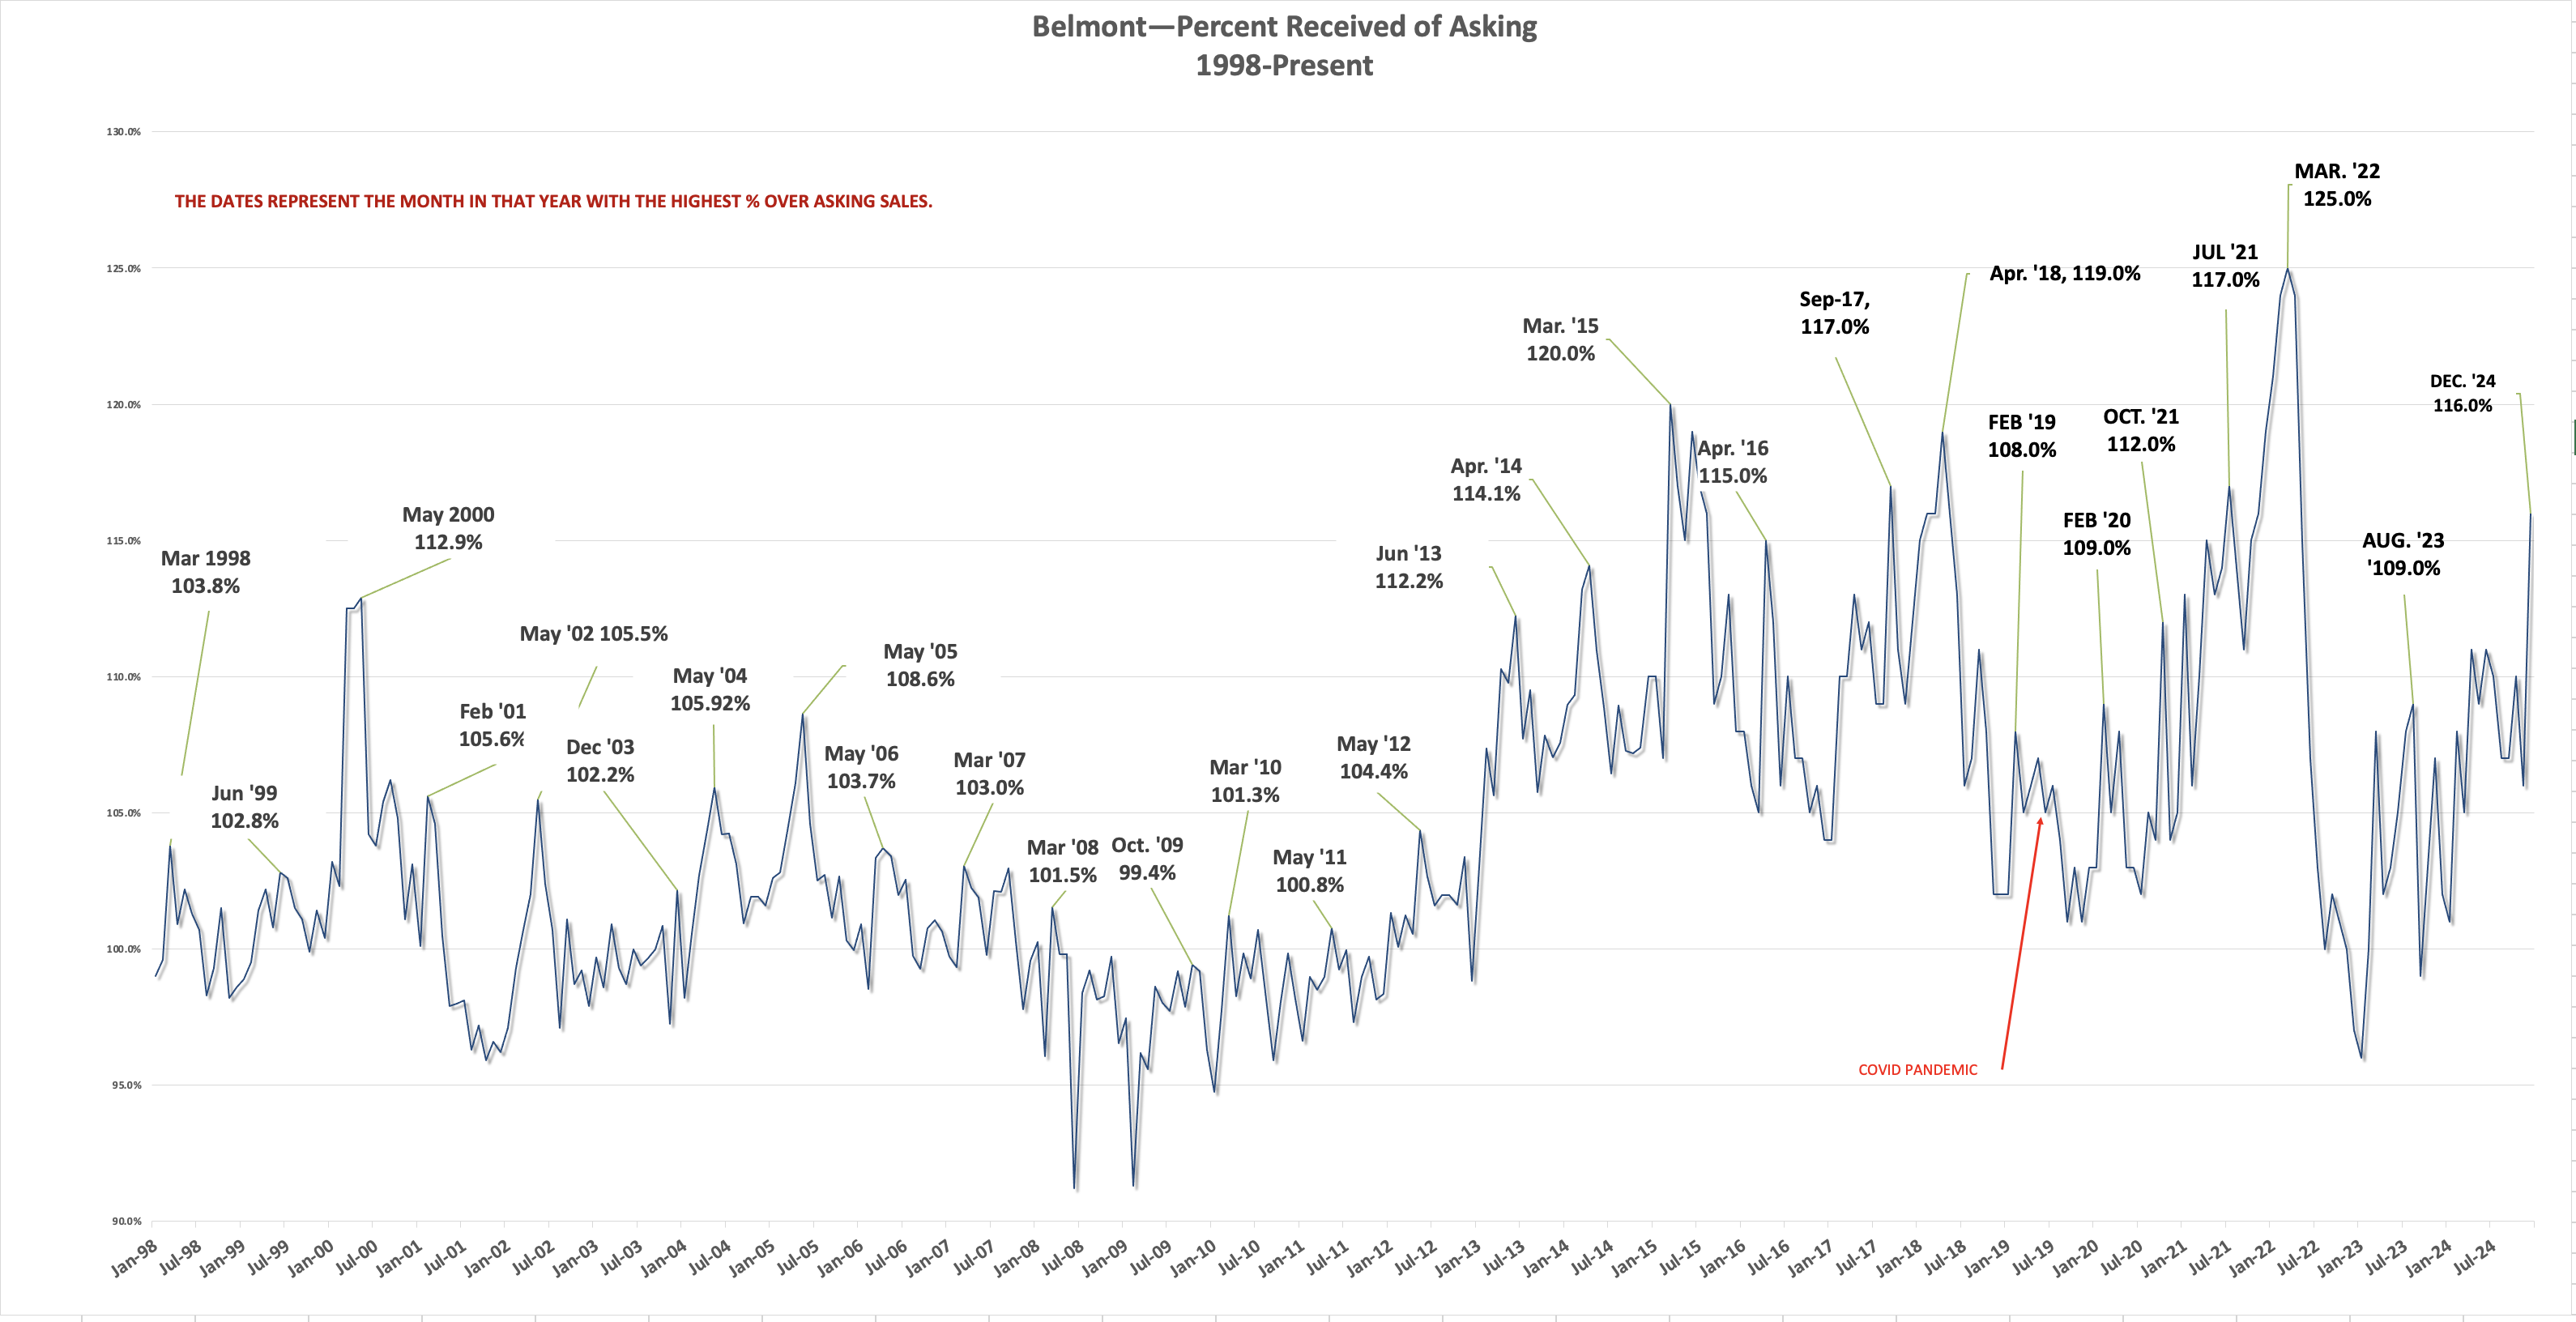
Belmont home seller’s eked out 4.4% more for their homes over their list price than last year during the same period.

In San Mateo County that number went up to 3.7% of asking

WRAP-UP

In every category in regards to home sale activity, Belmont outperformed and outpaced San Mateo County leading speculation that the peak for Belmont home values have not yet been reached.

Drew & Christine Morgan are REALTORS/NOTARY PUBLIC in Belmont, CA. with more than 20 years of experience in helping sellers and buyers in their community. As Diamond recipients, Drew and Christine are ranked in the top 50 RE/MAX agents nationwide and the top 3 in Northern California.  They may be reached at (650) 508.1441 or emailed at info@morganhomes.com.

For all you need to know about Belmont, subscribe to this blog right here. You can also follow us on Facebook at https://www.facebook.com/Morganhomes and on Twitter @ https://twitter.com/morganhomes

The information contained in this article is educational and intended for informational purposes only. It does not constitute real estate, tax or legal advice, nor does it substitute for advice specific to your situation. Always consult an appropriate professional familiar with your scenario


The Eleventh Hour on the Eleventh Day of the Eleventh Month—Where Will You Be?

The Eleventh Hour on the Eleventh Day of the Eleventh Month—Where Will You Be?

Veterans Day originated as “Armistice Day” on Nov. 11, 1919, the first anniversary of the end of World War I. Armistice is an agreement made by opposing sides in a war to stop fighting for a certain time— a truce.

Congress passed a resolution in 1926 for an annual observance, and Nov. 11 became a national holiday beginning in 1938.Veterans Day

Veterans Day is not to be confused with Memorial Day–a common misunderstanding, according to the U.S. Department of Veterans Affairs. Memorial Day (the fourth Monday in May) honors American service members who died in service to their country or as a result of injuries incurred during battle, while Veterans Day pays tribute to all American veterans–living or dead–but especially gives thanks to living veterans who served their country honorably during war or peacetime.

  • In 1954, President Eisenhower officially changed the name of the holiday from Armistice Day to Veterans Day.
  • In 1968, the Uniform Holidays Bill was passed by Congress, which moved the celebration of Veterans Day to the fourth Monday in October. The law went into effect in 1971, but in 1975 President Ford returned Veterans Day to November 11, due to the important historical significance of the date.
  • Britain, France, Australia and Canada also commemorate the veterans of World Wars I and II on or near November 11th: Canada has Remembrance Day, while Britain has Remembrance Sunday (the second Sunday of November). In Europe, Britain and the Commonwealth countries it is common to observe two minutes of silence at the eleventh hour on the eleventh day of the eleventh month.

_____________________________________________________________________________________

Drew & Christine Morgan are REALTORS/NOTARY PUBLIC in Belmont, CA. with more than 20 years of experience in helping sellers and buyers in their community. They may be reached at (650) 508.1441 or emailed at info@morganhomes.com.

For all you need to know about Belmont, subscribe to this blog right here. You can also follow us on Facebook at https://www.facebook.com/Morganhomes and on Twitter @ https://twitter.com/morganhomes

The information contained in this article is educational and intended for informational purposes only. It does not constitute real estate, tax or legal advice, nor does it substitute for advice specific to your situation. Always consult an appropriate professional familiar with your scenario.


Belmont Home Sales Suffer From A Stall

Belmont home sales this June suffered from the stall we predicted in this post back in May.

Comparing Belmont July of 2015 sales statistics to July of this year, they might look rather benign, but when you look a little deeper, you can see indications of what could be a slowing trend.

There were only two more listing this year than last, and even with seven more home sales in 2016 the inventory of unsold homes doubled. So did the months of inventory–rising from a minuscule .3 of a month to a mere .7—(still a ridiculously low number considering the U.S. housing inventory level hovers around six months). [CLICK THE IMAGE TO ENLARGE]

YOY June 2015-2016

While the $129,000 median drop in home prices might seem shocking at first glance, it’s mitigated to some degree since smaller homes sold this year. In fact, if we factor in the difference in the size of the homes in the two periods we come up with an almost identical median price year-over-year of $1,633,000.

We also see the price per square foot dropping from $906 to $824—and larger homes sold last year. Why is that important? Because larger homes statistically sell for less per square foot, since the land upon which they sit is not in the equation, yet can account for 50% or more of a home’s value.

And there’s the smoking gun—home prices did not go up in Belmont this June as compared to last. Not only that, but sellers received only 106% of their asking price compared to 119% in June of 2015. [CLICK THE IMAGE TO ENLARGE]

BELMONT jUNE 2016

Is it the unknown of Brexit? That served only to help lower mortgage payments—in theory giving buyers more buying power. It is an election year? This one is tumultuous. Whenever there’s an unknown in the air buyers tend to pull back, sit on the fence and wait it out—it’s human nature.

It could also simply be that we’ve hit a price threshold that the average buyer can no longer afford, or any combination of the above (or more). In any case, it was bound to happen at some point. The question is, have we hit that point?

Disclaimer:

Drew & Christine Morgan are REALTORS/NOTARY PUBLIC in Belmont, CA. with more than 20 years experience in helping sellers and buyers in their community. They may be reached at (650) 508.1441. 

The information contained in this article is educational and intended for informational purposes only. It does not constitute real estate, tax or legal advice, nor does it substitute for advice specific to your situation. Always consult an appropriate professional familiar with your scenario.

Drew & Christine Morgan did not necessarily participate in these sales


Belmont Home Values Peak–August 2015

It’s very hard to stare at numbers that are counterintuitive to what you feel about the market around you. This is the case once again in Belmont when we compare last August to August of 2015.

This August felt really slow—like there was a pull-back in the market. Many of our colleagues are still commenting about how if just feels different—but the numbers say something else.

One can account for the lag between an offer date and closing to explain away part of this nagging feeling, since most of the homes which closed in August were sales consummated in July. August could turn out to be a slow month when we look at September closings next October.

Certainly the stock market vacillation has people on edge and the Federal Reserve’s non-stop droning about interest rate hikes has people feeling uneasy, and when people feel uneasy they tend to pull back or even freeze, absent a clear path through the valley of the unknown.


We’ll summarize this very quickly for you: (click on the picture for a larger image).

Belmont August* Rinconada was our sale.

SALES—

The housing units sold over the two period was a dead tie at 24—so nothing to note there.

SIZE—

However the median size of a home which sold in the two periods was vastly different—as the homes which sold in 2015 were 450 sqft or 21.5% smaller and on lots 12% smaller.

MEDIAN PRICE—

That did nothing to dent the increase in the median home price, which rose another 20% year-over-year despite the homes were 21.5% smaller—that’s noticeable.

PRICE PER SQUARE FOOT—

We’d expect this to be higher, since smaller homes sell for more per square foot than their larger counterparts—and it was, 35% higher than last year.

So what’s the real median price increase if the homes are selling for 20% more and yet are 21.5% smaller? Let’s look at that difference of 450 sqft and multiply it by the amount at which homes are selling. To be conservative, we’ll use the smaller number a year ago of the larger homes—a median price per square foot of $665 x 450 = ~ $300,000, which we then add to the median price in 2015 of $1,517,500 to arrive at an adjusted median price of $1,817,500 or an adjusted 44% more year-over-year.

Looking at this from a different angle, what if we added the raw 20% year-over-year growth numbers and added to that 21.5% since the homes were that much smaller? We get 42.5% year-over-year.

Could it be that prices in August went up 40+ % year-over-year? No wonder the market feels like it’s slowing down. Home affordability is at its lowest point since the highs of 2009.


DISCLAIMER

Drew & Christine Morgan are REALTORS/NOTARY PUBLIC in Belmont, CA. with more than 20 years experience in helping sellers and buyers in their community. They may be reached at (650) 508.1441.

The information contained in this article is educational and intended for informational purposes only. It does not constitute real estate, tax or legal advice, nor does it substitute for advice specific to your situation. Always consult an appropriate professional familiar with your scenario.

Drew & Christine Morgan did not necessarily participate in these sales.

How to Find the Best Schools

This you already know: Parents want to send their kids to good schools. So that’s why they flock to neighborhoods—sometimes paying hundreds of thousands more to live there—that purport to have them. But what does “good school” really mean? Is it really all about the test scores?

Increasingly, educational experts say: not really. These days, many of them hail the importance of other, less tangible goals such as fostering social and emotional intelligence. Others tout the importance of executive function skills: the ability to plan, focus, remember instructions, and multitask. In the Finnish school system, purportedly the best in the world, academics are delayed, homework and testing are minimized, and free play time is valued.

But not so much in the U.S. With the ever-growing emphasis on standardized test scores, including for the new Common Core standards, educators and parents worry that schools are “teaching to the test” instead of teaching what kids need.

So how can you really figure out what that is? As with all things parenting, you have to decide for yourself what’s best for your family. Here are some tips on how to figure that out.

Determine what kind of learner your child is.

No matter what kids are required to learn, there are different ways to get them there.

Kids often have strikingly different learning styles. Some are visual, and fare better when things are illustrated rather than spoken; some learn better in groups; some are better able to focus if they’re alone. And some simply learn best by doing. And while no school caters entirely to one kind of learner, you may be able to find a school whose approach works better for your kid. Talk to the principal and teachers about how they accommodate different learning styles.

Find out if the school has the basics

Traditional barometers such as class size, student-to-teacher ratio and, yeah, test scores do matter—to some extent.

“They’re the best predictors of a school or district’s academic foundation,” says Bill Jackson, founder and CEO of GreatSchools, a nonprofit organization that provides nationwide school ratings. And schools need that foundation so they have something on which to build and to set goals.

Joyce Szuflita, an educational coach and founder of NYC School Help in New York City, has another view.

“If I were stuck on a desert island and could only ask for one piece of data while considering a school for my child, I’d want to know the percentage of kids who are chronically absent,” she says, arguing that a high attendance rate indicates a positive school culture in which the staff, students, and parents are all committed to success.

Look beyond academic development

In addition to solid academics, experts increasingly tout the importance of a holistic education, which cultivates students’ moral, emotional, physical, and psychological aptitudes.

Schools with programs that teach empathy, self-motivation, and adaptability—or emotional intelligence—equip students with the life skills proven to foster success. Having a high IQ might demonstrate mastery of a body of knowledge, but a high EQ (emotional quotient) indicates that a student can be flexible and understanding, synthesize information and successfully interact with all kinds of people, which might be better predictors of future success than high grades or scores.

Seek creative learning opportunities

Forget rote memorization; the academic and intellectual skills needed to thrive in tomorrow’s multinational, dynamic workforce aren’t the same as those that led to success before the millennium.

“Expansive ideas and creative thinking will become even more essential in the future,” says Dr. Shimi Kang, author of the forthcoming book “The Self-Motivated Kid: How to Raise Happy, Healthy Children Who Know What They Want and Go After It (Without Being Told).” Consequently, she contends that a “good” school today is one that helps foster 21st-century skills such as creativity, collaboration, communication, and critical thinking.

These might be schools with highly developed music programs, team sports, extracurricular clubs with broad focus (environmental protection, community service, even juggling or a “Harry Potter”-themed Wizards & Muggles club)—any activity that develops diligence, creativity, and quick thinking.

Consider lower-ranked or up-and-coming schools

Szuflita suggests resisting the urge to follow the crowds to the “best” schools in town, which could have problems with overcrowding and waitlists, despite their virtues. Instead, track the progress of previously overlooked schools, ones that may have a new principal, an increasingly active PTA, and/or an attendance rate that has steadily risen, even if the school itself doesn’t have the most stellar reputation or highest rankings.

Research (free) alternatives to public schools.

Themed charter schools (which receive public funding but operate outside of their regional public school districts) or magnet schools (public schools with specialized courses or curricula that draw students from across school districts or zones) infuse their offerings and activities with a specific emphasis.

At Expeditionary Learning schools (nationwide), for instance, students study a single topic from many angles. Heavy emphasis is placed on the importance of nature, reflection, and service, and classes can involve Outward Bound–style excursions.

The tuition-free Muskegon Montessori Academy for Environmental Change in Norton Shores, MI, drives home the importance of clean water by having students care for the local river.

Schools that take the multiple intelligences view recognize that intellect comes in many forms (e.g., word smart, people smart, numbers smart) and teach to individuals’ strengths.

Check out the ‘vibe’—it really means something.

This may seem obvious, but we can’t stress it enough: Go see the schools for yourself, and visit as many as possible. (By the way, did you know you can search for homes by school district on our app?) You might discover what you thought was important isn’t really at all. And test scores and state rankings don’t convey the important yet difficult-to-quantify vibe of a place.

“Actually experiencing a school is the best way to inspect the vitality of the work, the energy of the teachers, and the rapport between the staff and students,” says Szuflita.

One tip: Arrive early to the visit, so you can evaluate the school when no one is looking.

Ask yourself what ‘good’ means to you.

What do you want from your school? Racial and economic diversity? Sports and arts programs? A campus? Leadership/internship opportunities? Is your No. 1 criterion a neighborhood school that you can invest and create community in, even if it means sacrificing a few things like class size or an emphasis on the arts?

If traditional academics and high test scores really are the most important things, you’re lucky: Those are the easiest things to find.

Today, finding a good school means you grown-ups have to do serious homework, figuring out the best fit for your family and zeroing in on schools that are equipping students with the skills and experiences that will lead to a broader definition of success.

Anything else no longer makes the grade.

Contributed by Audrey Brashich
Audrey D. Brashich writes regularly about trending pop culture issues for The Washington Post, Yahoo Parenting and other national news outlets. She is also the author of All Made Up: A Girl’s Guide to Seeing Through Celebrity Hype and Celebrating Real Beauty.

Housing Market Prices Halve

With the Autumnal Equinox just around the corner, we look back a great summer. Now to get caught up on the housing market since we’ve took some much needed time off.

On the national level…we gleam this insight from Standard and Poor’s website…

“Home price gains continue to ease as they have since last fall,” says David M. Blitzer, Chairman of the Index Committee at S&P Dow Jones Indices. “For the first time since February 2008, all cities showed lower annual rates than the previous month. Other housing indicators – starts, existing home sales and builders’ sentiment – are positive. Taken together, these point to a more normal housing sector.

“The monthly National Index rose 0.9% in June. While all 20 cities saw higher home prices over the last 12 months, all experienced slower gains. In San Francisco, the pace of price increases halved since late last summer. The Sun Belt cities – Las Vegas, Phoenix, Miami and Tampa – all remain a third or more below their peak prices set almost a decade ago.

“Bargain basement mortgage rates won’t continue forever; recent improvements in the labor markets and comments from Fed chair Janet Yellen and others hint that interest rates could rise as soon as the first quarter of 2015. Rising mortgage rates won’t send housing into a tailspin, but will further dampen price gains.”

“All 20 cities used for the Case-Shiller report saw their year-over-year rates weaken in June. For the second consecutive month, San Francisco saw its rate decelerate by almost three percentage points – from 18.4% in April to 12.9% in June. Phoenix showed its smallest year-over-year gain of 6.9% since March 2012. Cleveland showed a marginal increase of 0.8% over the last 12 months while Las Vegas led with a gain of 15.2%. All cities reported price increases for the third consecutive month; it would have been a fourth had New York not declined 0.4% in March. San Francisco posted its eighth consecutive price increase but showed its smallest gain of 0.3% since February. Five cities – Detroit, Las Vegas, New York, Phoenix and San Diego – posted larger gains in June than in May. Dallas and Denver continue to set new peaks while Detroit remains the only city below its January 2000 value.”

Everybody wants to know when this crazy market will end.  People just can’t imagine that it will continue at this pace—and of course it won’t, and it didn’t and we’ve been predicating this all along; that the rate of appreciation would wane once home prices rebounded to levels which are sustainable.

The housing market dropped too far and filling that void happened very fast—essentially 2012 until now. We are now reaching new high home values and people are just plain being priced out—with fewer and fewer people who can afford the median price home.  But while the rate of appreciation is slowing, home values are continuing to rise, just at a much more sustainable and slower pace.

The San Francisco MSA (which consists of the counties of San Francisco, Marin, San Mateo, Contra Costa and Alameda), while experiencing a slowdown in the rate of appreciation (by almost half), nevertheless still enjoyed a 12.9% increase year-over-year.  You can see a graph we’ve put together of the SF MSA data points illustrating the trend over the past 27 years.

*Note—the Standard & Poor’s Index lags the market by three months.

The good news is a home won’t cost you 25% more next year, probably just around 10%. But who wants to pay a 10% penalty for waiting?


Disclaimer:

Drew & Christine Morgan are REALTORS/NOTARY PUBLIC in Belmont, CA. with more than 20 years experience in helping sellers and buyers in their community. They may be reached at (650) 508.1441 or emailed at info@morganhomes.com.

The information contained in this article is educational and intended for informational purposes only. It does not constitute real estate, tax or legal advice, nor does it substitute for advice specific to your situation. Always consult an appropriate professional familiar with your scenario.

Housing Market Cooling Down?

Are Belmont home values or sales tapering off? Are we in for a cool down?

This month we look at April 2014 sales for Belmont to see if home sales or values are waning.

There’s much speculation even among our colleagues as to what is happening in our market and how sustainable our current housing environment may be. Most agents believe that we cannot continue at this pace but beyond that there seems to be no quorum on where the market will go from here.

Rather than guess what may happen next we like to watch what is happening to see if there’s a pattern.

Each year our housing market endures seasonal fluctuations at various times which affect the inventory levels, the number of sales, the number of new listings and even the percent a seller receives. Varying market conditions weigh more heavily on the median home price and the days on market.

When we look at April’s number for 2014 we’re comparing year-over-year numbers for the same period. This way we can objectively analyze where we should be in the seasonal sales cycle and dispense with any hyperbole about whether the market is “cooling down” or “heating up”.

Whenever there’s even a slight shift in the wind of inventory or sales from one month to another it’s second nature for agents to think the market has shifted into a cool off phase, when often it’s nothing more than a seasonal fluctuation which should be expected.

Looking at the important statistics we track each year, we went back to the beginning of when our Multiple Listing Service retained records—1998.
The question at hand is not whether April sales or listings are up or down as compared to March, the question is how do April’s numbers compare to every other April?

In analyzing the April markets, we allowed for a small adjustment when looking at the numbers for each April to avoid comparing dissimilar markets and to eliminate a wash-out of statistical values. We not only compared ever April since 1998 to April of 2014, we also compared every hot April market and every slow April market.

APRIL 2014


[click on the picture for a larger view]

PERCENT RECEIVEDHot Market vs slow
In each case April 2014 indicated an intense market. For example, the percentage a seller receives of their asking price in April has averaged right around 103% since 1998. In slow markets April’s percentage received has been a paltry 99.6% and in hot markets it has skyrocketed to 105.69%. This April it stood at 114.09%–8.7% higher—and 8% higher than the previous high in 2006 at what was then the peak of the market.

NEW LISTINGS
The number of new listings which have come on the market in April of each year has averaged 35. In a slow market Belmont averages 39 new listings for sale and in a hot market 32. The previous high listing count was in 2005 when 43 new listing hit the market. This year there were only 25–a low not seen since the slow down in 2007 when there were only 23. The current number of new listings hitting the market is statistically aligned with that of a slow market–not a hot one. Remember, this is April under a microscope. Lower than typical inventory could serve to continue to put upward pressure on values.

MONTHS OF INVENTORY
The time it would take to sell all of the homes currently on the market at the current rate of sales is referred to as the “Months of Inventory”. It’s designed to provide a useful ratio between listings and sales. Expressed as in terms of “months”, it’s a good indication of the strength of any housing market. April’s months of inventory has averaged 2.44 months over the past 16 years. In slow years it has averaged 3.73 months and in hot markets averaged 1.54. In April of 2014 it stood at 1.0–an all-time low with April of 2005 coming in second at 1.21 months. Nationally, this number stands around 6.3 months.

When sales are down from March to April, or the number of new listings rises incrementally—as they did this March to April when three more homes came on the market, it’s less important than where they should be historically.

The most interesting pattern we observed was when we filtered out for hot and cool markets. We notice that periods of hot and cool markets seemed to last about three to four years each before a correction. The last correction began in 2012. Has the market peaked? Statistically speaking, April should soon…

Disclaimer:

Drew & Christine Morgan are REALTORS/NOTARY PUBLIC in Belmont, CA. with more than 20 years experience in helping sellers and buyers in their community. They may be reached at (650) 508.1441 or emailed at info@morganhomes.com.

The information contained in this article is educational and intended for informational purposes only. It does not constitute real estate, tax or legal advice, nor does it substitute for advice specific to your situation. Always consult an appropriate professional familiar with your scenario.

Drew & Christine Morgan did not necessarily participate in these sales.


Which City Is More Affordable–Belmont or San Carlos

Belmont vs San Carlos Home Values

NOTE: This post is in response you a question posed on the Belmont Patch:

Q.    How does Belmont’s property prices rise compare with nearby San Carlos’ which has the Laurel Street downtown and the industrial area?

A.  To answer this question as posted on the Patch by Gladwyn d’Souza, we had to do compare home sales and price points in Belmont to San Carlos over a period of time to see if any trend appeared.

We chose 2006-2013, which effectively covers the period right before and through our local housing recession and into the recovery.

We’ve spent a week looking at the numbers and trying as best we could to put them into a comprehensive perspective without analysis paralysis setting in.

The short answer is Belmont is lagging the home price appreciation of San Carlos. But there’s a lot more to it than that. If I’m reading into the question correctly, (since we received more than one request for this analysis) essentially people want to find out if having an industrial and downtown area creates more value in the local housing market and if that influences the rate at which homes appreciate—which is a slightly different question than just trying to answer if homes near a downtown cost more—this question includes do homes go up in value at a faster rate than surrounding areas. If I am paraphrasing that incorrectly, I apologize.

Unfortunately, the Patch limits how long we our response to a post can be so we are including this link to our own blog page where we can give the answer justice as well as add the appropriate graphs and documentation. We invite you to join us here for our in-depth answer.

Let’s begin by answering the question do the homes values go up at a faster rate…

We need not involve Belmont for this part of the analysis—not yet. That actually serves to complicate the answer because first we need to know if the homes near downtown San Carlos are indeed going up at a faster rate than homes which are not near downtown. This methodology eliminates  unnecessary variables created by comparing two cities which could unjustly influence the results—issue such as weather, governance, schools, transportation, shopping, etcetera—to name a few.

Our Multiple Listing Service allows us to break down sales by rather arbitrary but effective boundaries. For example we can look at the White Oaks area in San Carlos and compare it to the homes just north of Holly on the Belmont border, or homes which are more sequestered in the San Carlos hills on Crestview.

White Oaks SQFT LOT $/SQFT Median Price Rate of App Size Diff Adjusted Rate $/SQFT

2011

1600

6000

$538

$932,000

2012

1501

6300

$629

$950,000

1.9%

-6.6%

8.5%

16.9%

2013

1775

5760

$759

$1,352,000

42.3%

15.4%

26.9%

20.6%

SCL Hills Rate Size

2011

2175

8058

$498

$998,000

2012

2090

8400

$546

$1,105,000

10.7%

-3.9%

14.6%

9.7%

2013

2170

8300

$629

$1,380,000

24.9%

3.8%

28.7%

15.2%


As one can see the raw rate of median home price appreciation is considerably higher in the White Oaks than in the San Carlos Hills. And when we compare the price per square foot we arrive at the same conclusion—that homes near downtown in San Carlos coast more per square foot and are going up at a faster rate. However, the adjusted rate takes into consideration the variation in the size of homes selling in these two areas. We factored that in as best we could—admittedly it’s not a perfect system but, for example, in the White Oaks on 2013 we surmised that if the raw rate of appreciation was 42.3% over the prior year, but the homes were 15.4% larger, then we are not comparing apples to apples. So to be consistent we subtracted this variance from the rate of appreciation for an “adjusted rate”. Normalizing these two variables offers up a much more stable rate of appreciation and probably closer to the actual difference in these two areas—which isn’t much.

Clearly it appears that people are willing to pay more to be closer to a downtown as is evidenced in the Bel-Carlos map below illustrating the price per square foot people are willing to pay. Does that fully answer the question of are homes near downtown selling for more—or appreciating at a higher rate? Certainly not. The reason is complex and two-fold. First, homes in areas which were harder hit by the housing market collapse are enjoying a higher rate of appreciation—counterintuitive perhaps to their respective locations—because they have a greater distance to rebound—in other words, the values dropped further and faster in these areas hence they are rebounding at an inverse rate.

Case in point, the Sterling Downs area of Belmont. Known for its superior microclimate weather, this area is home to many original floor plans  which consisted of a 1,010 Sqft three bedroom 1 bath home. At that size, the price point for these homes was less than surrounding larger Belmont homes and much more affordable to the first-time homebuyer—many of the very homeowners who found themselves in financial trouble when the housing market imploded. In Sterling downs in 2011 there were only 10 sales—two of which were distressed sales. Simply put—many could not afford to sell and take a loss in 2011. In 2012 the number of sales shot up to 19 but eight were distressed sales, while in 2013 a whopping 33 sales were logged and only 1 was a distress sale. It’s easy to see with values plummeting more in Sterling Downs than others areas of Belmont it’s no wonder they are bouncing back at a higher rate. And they just happen to be closer to downtown…

Sterling Downs SQFT Lot $/SQFT Median Price Rate App Size Adjusted $/SQFT Inc.

2011

1469

5387.5

$443

$667,000

2012

1190

5330

$539

$650,000

-2.5%

-23.4%

20.9%

21.6%

2013

1190

5000

$673

$825,000

26.9%

0.0%

26.9%

24.8%

Belmont Heights SQFT Lot $/SQFT Median Price Rate App Size Adjusted $/SQFT Inc.

2011

2500

9639

$515

$1,221,000

2012

2150

9600

$539

$1,121,050

-8.2%

-16.3%

8.1%

4.7%

2013

2480

8990

$613

$1,400,000

24.9%

13.3%

11.6%

13.7%


The second factor skewing the results is that homes which are smaller sell for less per square foot.

Is price per square foot the most accurate statistic for analysis to reflect the true picture of an areas worth? Not really, and here’s why. Larger homes sell for less per square foot because land, not factored into the calculation, accounts for more than 50% of a home’s worth. Therefore a relatively small 1,010 square foot home in Sterling downs will sell for more per square foot than one in Belmont Heights (Hallmark Area) which average 2,010 square feet in size, yet the median price is far less in Sterling Downs.

Empirically speaking, we know that people pay a lot of money for very small homes near downtown San Carlos—finding the data to clearly illustrate the phenomenon has proven more difficult.

Now for the bigger question of how does the rate of appreciation in San Carlos compare to that of Belmont’s?

Belmont vs San Carlos Median PriceTrendWhat the numbers illustrate is that San Carlos has a higher median home price than that of its neighbor to the north, Belmont, and as long as we’ve lived here (which is now going on over 21 years) it always has.


San Carlos  Increse over BelWe’ve noticed in both recent market corrections (1989 and 2007), that as the market cools, so does the discrepancy between the two city’s median home price. And when there’s a bull housing market, San Carlos begins to pull away at a higher rate of appreciation. Of course as in nature, a sort of market equilibrium begins to set in when values are too far apart to lessen the disparity in home prices—akin to water filling a void.


Here we see that not only do you pay more to live in San Carlos you also get a smaller home for the money. And since the lot sizes in the two areas are relatively similar, larger lot sizes in one area which could affect values can be ignored.

Median Price SQFT %Median∆ %SQFT∆ Adjusted ∆
Belmont 2013

$1,088,000

1840

San Carlos 2013

$1,210,000

1765

10.1%

-4.2%

14.3%

The raw data show that the median home price in San Carlos in 2013 was 10.1% higher than Belmont’s, but since one also gets a home 4.2% smaller we adjusted the true estimated median home price differential to be close to 14.3%. Calculating it another way, if we take the difference in the size of homes selling and multiply it by the price per square foot of San Carlos homes we get an additional $52,000 of appreciation bringing our median home price increase in San Carlos over Belmont closer to 16% for the year.

So it appears that the same home in San Carlos will cost you about 14-16% more–no matter where in San Carlos it is located.  The next question to attempt to answer is why?

Imagine if Belmont and San Carlos had no border? After all, the city borders exist on maps but in reality the imaginary borders are crossed frequently as Belmont and San Carlos residents have unfettered access to their neighboring cities amenities (except at the end of Hallmark Drive and Crestview).

What if we removed the artificial borders and created one large new town called Bel-Carlos, for our analysis. Now it’s just one big happy city with various neighborhoods-like it really is. Because last we checked San Carlos and Belmont offered reciprocity to their neighboring cities for access to shopping, restaurants and parks—you name it. Would a person really choose to live in San Carlos and pay more just to enjoy the distinction that their city had a downtown? After all, they could live a few blocks north and get to the same restaurants and stores?

We think that the proximity to the downtown is more attractive than the mere fact that one exists. To illustrate this we see that the values near downtown in San Carlos (price per square foot) are greater than neighborhoods further away—in San Carlos and Belmont.

Bel Carlos Map

In this map we combined San Carlos and Belmont to create a borderless “Bel-Carlos” and then we used data since 2007 in each area to examine the price per square foot which homes sold for.  In almost each case San Carlos homes cost per square foot exceeded that of Belmont’s in the neighborhoods we examined.

Now in our new city, Bel-Carlos we have the same distinction. Some neighborhoods in Bel-Carlos are more expensive (per square foot) than others. Offering walking distance to Bel-Carlos’ fine dining fetches a higher price per square foot than neighborhoods further away.

Overall, the home values in San Carlos are higher and go up at a faster rate than those of her neighboring city of Belmont. Is it that San Carlos has a larger downtown with many fine restaurants, the warmer weather, shopping opportunities, community involvement or the city governance? It’s most likely all of the above. That said, there are many who choose Belmont for the beauty of the hills, proximity to major commute arteries, and the cooler mountain air.

Whichever city you choose you call home, we’re here to help.

Disclaimer:

Drew & Christine Morgan are REALTORS/NOTARY PUBLIC in Belmont, CA. with more than 20 years experience in helping sellers and buyers in their community. They may be reached at (650) 508.1441 or email at info@morganhomes.com.

The information contained in this article is educational and intended for informational purposes only. It does not constitute real estate, tax or legal advice, nor does it substitute for advice specific to your situation. Always consult an appropriate professional familiar with your scenario.


What Does Q4 Have in Store for Our Local Housing Market?

Is it a bubble?Now that the media is hyping our local market once again with horror stories of multiple offers, and media proclaimed “Bidding Wars”, our attention turns to watching for signs of a change in the tempo of sales and/or over asking offers. Everyone knows the Peninsula housing market is red hot, and has been for more than a year now. The question now becomes, “When will it change?”

Some Pundits are already predicting a crash in what they perceive as an overheated housing bubble. Of course if they continue droning on about a market crash their theory eventually may come to fruition, but for now their bubble is more akin to a hot air balloon with scant facts to back it up.

The Case-Shiller report by Standard & Poor’s is a good macro-barometer of our Bay Area housing market and the nation as a whole. The Case-Shiller report, most recently released on September 24th 2013, showed an increase in the 20 largest housing markets across the country. In our area or “MSA” (Metropolitan Statistical Area), which includes the Napa, San Francisco, San Mateo Alameda and Contra Costa Counties, the index had risen 25% from July 2012 through July 2013 [Case-Shiller reports are delayed by three months so the September reports was actually for July].

Economists, like the National Association of REALTOR’S Lawrence Yun, have warned that prices have been rising “too fast” and at these double-digit rates of appreciation are “unsustainable”. We couldn’t agree more. The current rate is unsustainable in the long run, but we believe that many factors already in play will mitigate the danger of a bubble. But let’s take a small step back. Part of the reason that home prices have increased so dramatically is that in many areas they were below reasonable market values for so long that just returning to normal would be a huge increase. Many areas saw homes values plummet below the cost of construction. Home prices have not reached the May 2006 peak where the SF MSA stood at a whopping 218—24% higher than today. At the current rate of price increase home values would reach the peak seen in May of 2006 in one year from now.

We don’t believe that will happen—not even in the crazy Bay Area real estate market. Why?

What’s already in play to slow the engine of appreciation and avoid another economic train wreck?

  • More homes are being built as companies try to meet the new housing demands—this takes pressure off of the tight inventory
  • Interest rates will begin rising making homes less affordable—this will put pressure on price increases and most certainly limit over asking offers
  • More equity sellers are being created every day—more inventory will mean less upward pressure on prices
  • Investors are taking a break—as interest rates rise and unbelievable deals once had from the recession are gone, investors look for other opportunities outside of housing. Less competition for homes will help keep a lid on housing inflation.

According to the Case-Shiller study, “Since April 2013, all 20 cities are up month to month; however, the monthly rates of price gains have declined. More cities are experiencing slow gains each month than the previous month, suggesting that the rate of increase may have peaked.

Morgan Brennan who writes for Forbes Magazine on U.S. Housing markets, summed it up best in her article back in June titled “3 Reasons The ‘Bubble-Like’ Surge in Home Prices Won’t Last“. And since we agree with her sentiments, rather than re-invent the wheel we rather encourage you to read more about her theory.


Disclaimer:

Drew & Christine Morgan are REALTORS/NOTARY PUBLIC in Belmont, CA. with more than 20 years experience in helping sellers and buyers in their community. They may be reached at (650) 508.1441.

The information contained in this article is educational and intended for informational purposes only. It does not constitute real estate, tax or legal advice, nor does it substitute for advice specific to your situation. Always consult an appropriate professional familiar with your scenario.

Bay Area Home Prices Rise But Interest Rates May Dampen Values

The price of homes in the Bay Area rose 25% or more in the last year. So how does one cope with the rising tide of home values? For that, we offer you a new way of looking at the circumstances.

Perfect Storm

When gas prices shot up close to $5.00 per gallon a few years back, a friend of mine was waxing on about how much more it now cost him to put gas in his car. He was puzzled when I told him I wasn’t spending any more at the pump than before. “Why not?” he exclaimed. I told him it was simple, when I arrive at the gas station I pump $50.00 of gas into my car, whatever the price of gas—so it never costs me more than $50.00 at any visit to the gas station.

While at first this may appear to be lacking in the critical thinking department, the only real dilemma is that of course with less gas in your tank, one can’t drive as far.

We bring this up because our local real estate market will soon be suffering the same fate. Buyers will be forced to decide if they are willing to pay more for the same home, or settle for less home to keep their payment the same.

Why Higher Interest Rates May Change the LandscapeThe Wall Street Journal reported on Friday that Wells Fargo—the nation’s largest market for refinancing and purchase mortgage loans—was cutting its staff by another 2,300 jobs nationwide. The reason? Wells Fargo owned 30% of the mortgage market until recently when the bank’s market share dropped this quarter to 23% of mortgage originations, according to Inside Mortgage Finance.

Refinance as a percentage of mortgage applications were 54% in the second quarter, down from 69% in the year earlier period—and Wells Fargo is assuming it will get worse. So if the nation’s largest mortgage lending institution is betting that refinances will continue to wane due to an inevitable rise in interest rates, it begs the issue to consider the impact this will have on our local market.

Buyers have enjoyed relatively inexpensive purchase money loans enabling them to afford more home and rationalize bidding thousands of dollars over the seller’s asking price.  But with home prices rising 26% in the Bay Area year-over year, buyers have already had to make a choice between paying on average 26% more for the same home they could have bought a year earlier, or settling for a home 26% smaller.

This summer, interest rates are already over 1% more than where they were a year ago; and we expect they will continue to rise. Buyers will either learn to set their expectations lower, or pay more to remain competitive.

If you own a home and have been considering a move, you may have been reluctant to sell when values appear to be rising at an exponential rate. But the days of double digit appreciation may already be waning. Conditions are very favorable for selling your home today, but whether or not they will remain so, or get better or worse, is a guess at best. It is yet to be determined how rising rates could alter the glorious real estate landscape sellers have enjoyed over the last year. If high demand continues along with low inventory levels, it might be possible for multiple offers to remain a norm with over asking bids. But if the higher median home prices have created more enough equity sellers, and inventory increases as demand diminishes—a  direct result of challenging affordability with higher rates and prices—many seller’s may have wished they took advantage of the perfect storm in 2013.

Disclaimer:

Drew & Christine Morgan are REALTORS/NOTARY PUBLIC in Belmont, CA with RE/MAX Star Properties. with more than 20 years’ experience in helping sellers and buyers in their community. They may be reached at (650) 508.1441.


The information contained in this article is educational and intended for informational purposes only. It does not constitute real estate, tax or legal advice, nor does it substitute for advice specific to your situation. Always consult an appropriate professional familiar with your scenario.