Sales That Drive Our Economy…

There are great deals to be had on appliances right now. Sales

Everyone knows that the U.S. economy is driven to a large degree by consumer spending. Tighter post-Christmas spending patterns create a need for stores to offer up sales and financing deals to lure consumers back to the stores. Check out Best Buy and Circuit City to see the amazing deals one can get right now!

This year with consumer confidence low, the average consumer will pull back even more. That translates into great deals for the savvy (or fortuitous) consumer who’s waited to buy. On big ticket items such as plasma TV’s and refrigerators it’s not unusual to see low or no interest rate financing options today—even free delivery.

Tv When will these offers end? They’ll end when consumers return to more bullish spending patterns. When will that happen—of course no one knows. The only indication will be when you are no longer offered deferred or low interest finance rates and deep discounts—watch the ads.

How does that translate into real estate? Actually, perfectly. The same forces are at work and the same indicators available. You’ll know when was the best time to buy just after it passed.

                                    Live your life.

*The information contained is educational and intended for informational purposes only. It does not constitute legal advice, nor does it substitute for professional advice.

Median Bay Area Home Price Near Worthless

What You Hear About Median Home Values May Be Completely Wrong

The Multiple Listing Service for the Bay Area peninsula has launched the December sales stats and there is some compelling evidence that Bay Area homes values dropped slightly over 2006.

The median home price is the midpoint at which half of the homes sold for more, and half sold for less. Of course if smaller or larger homes are selling then these numbers are easily skewed—especially with a small market sample.

SMC 2007San Mateo County posted a reduction in the median home price to $885,000–a $40,000 (4.3%) decline over $925,000 in 2006.

This statistic could be wildly inaccurate though. Simply put, there’s no easy way to determine if the size homes which sold in a given year were larger or smaller than a previous year’s. Intuitively, given a large sample–totaling all sales for San Mateo County for example, one would expect the median size home to remain relatively constant and thus portray an accurate picture of the median home values. But unique market forces such as the ones we are currently experiencing are just the sort of thing that could skew those numbers. If for example, more first-time buyers purchased homes, the median size home included in the sales calculations would undoubtedly be smaller and thus skew the median price lower.

The Multiple Listing Service (or MLS system) which essentially retains all agent related transactions has its own inherent flaws. They derive the median home value by taking the median price for every home sold in a given year. If the housing market has a dramatic shift during the course of the year, it’s entirely possible that the median home price reported has nothing to do with the home values at the end of the year on December 31st.  In other words, it matters not whether home values climb for the first quarter of 2007, if in December they’ve dropped dramatically. The MLS median price is more a measurement of the average median value rather than the true median price at the end of the year.

Last year was a prime example of why reporting the median home price in this fashion is erroneous at best. In Belmont for example, there were 94 sales in the first six months of 2006 and 92 in 2007–virtually unchanged. However, the next six months after the July mortgage issues came to light, there were only 127 sales in 2007 compared to 167 in 2006. It’s a strong indication that the market changed in the second part of the year and why measuring the median values at the end of the year, rather than reporting the aggregate is a methodology more suited to a changing market.

In a small market sample such as the town we live in, Belmont, Ca, it’s even more imperative that one adjust for the median size of homes which sold. We incorporate this onto our calculations and low and behold an entirely different picture emerges.

Hello 2008!

We’re busy compiling the numbers from 2007 to see where the housing market ended compared to 2006. Of course the peninsula market fared relatively well compared to many California cities and that of other states.

Why did certain areas do better? We look at understanding the issues which caused the current market conditions to predict which areas will be impacted more than others.

The jolt that knocked over the housing house of cards was interest rates and adjustable teaser rates indexing to higher levels. In the past five years many investment properties were purchased with adjustable loans. This enabled an investor to break-even on their mortgage payment vs. the rent they could charge. With properties appreciating at levels from 20-50% per year, it’s easy to see why so many investors jumped at the chance to buy in a new development. A new home often means great financing (available through the developer); purchase incentives, literally no maintenance issues; in fact many speculators purchased unfinished homes and re-sold them six months later at completion for a tidy profit.

The first shoe to drop:

When interest rates began rising many speculative investments became less lucrative. As investors began selling off properties in droves, inventory grew and home values dropped.

The second shoe to drop:
Owner occupied homeowners also found themselves in difficult situations. Many had qualified for their loans based on a teaser start rate. Once the rates fully adjusted, they could no longer afford their home (the practice of qualifying people for a loan at the teaser start rates has been discontinued by every lending institution we know). Faced with lower values, many could not sell their home for what they owed. The result was an increase in foreclosures and short sales.

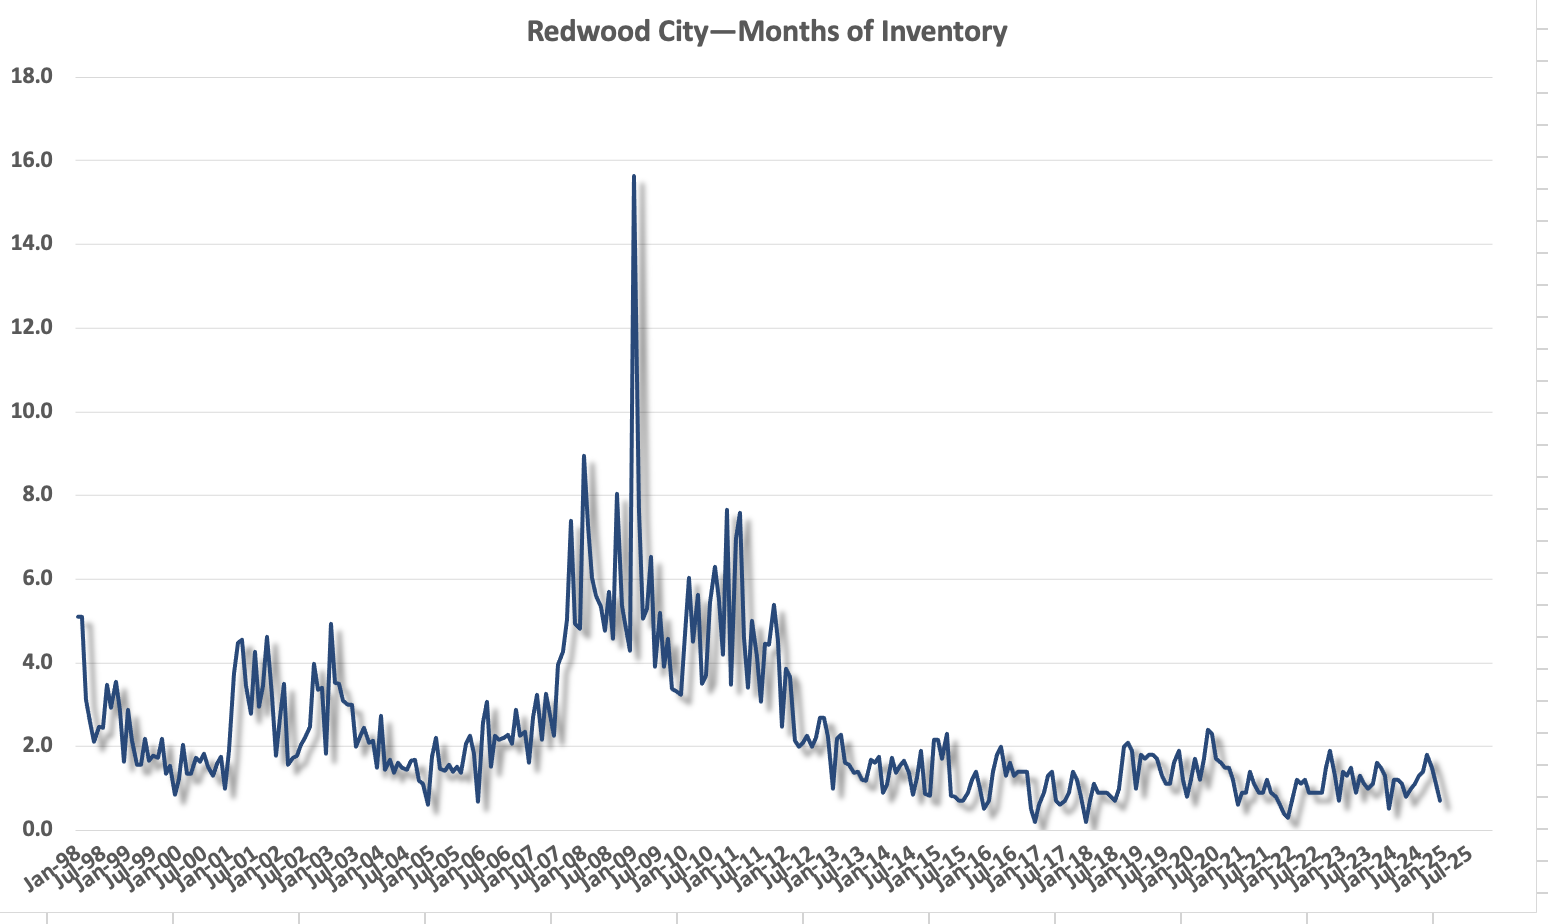
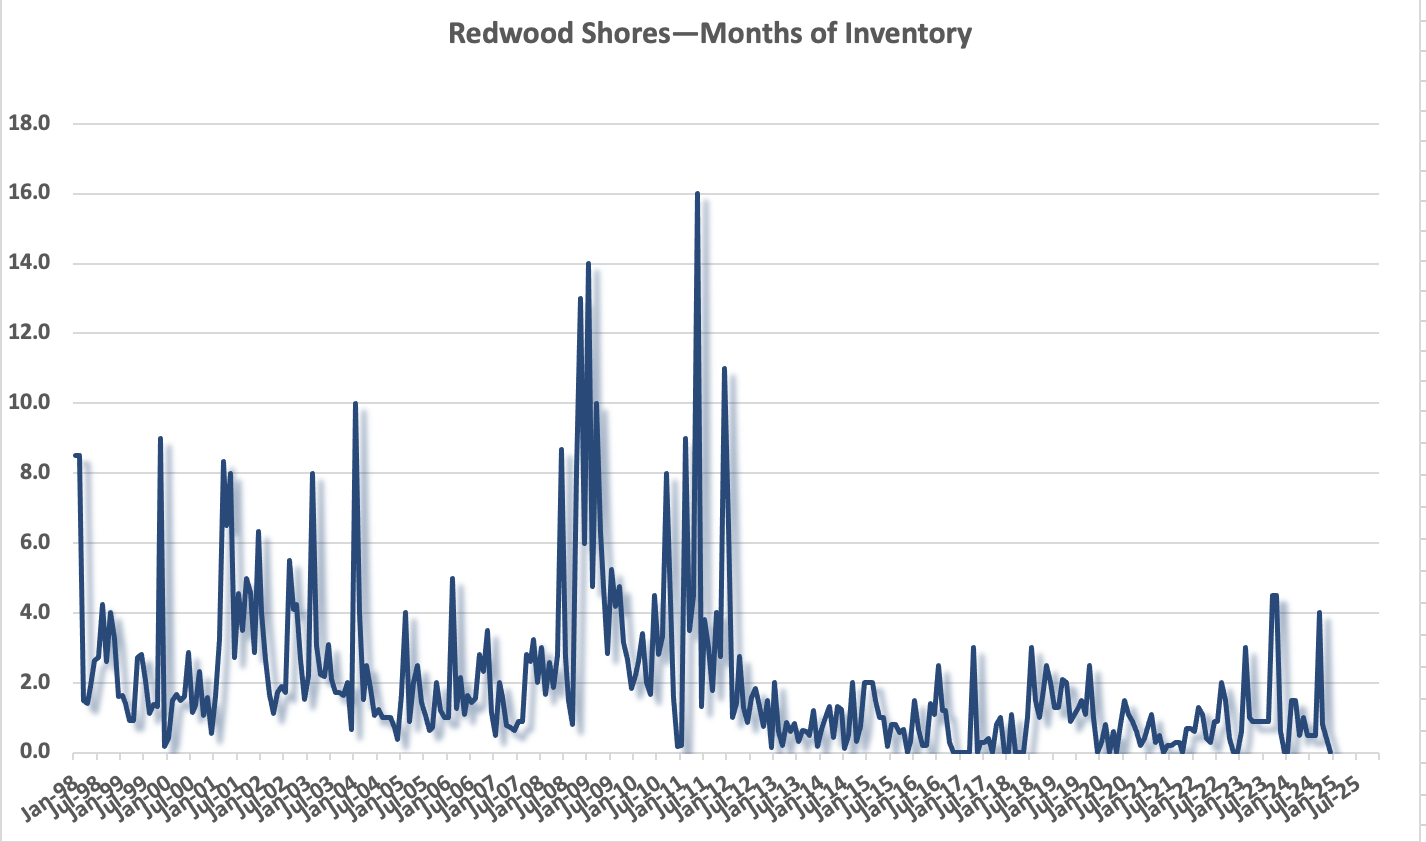
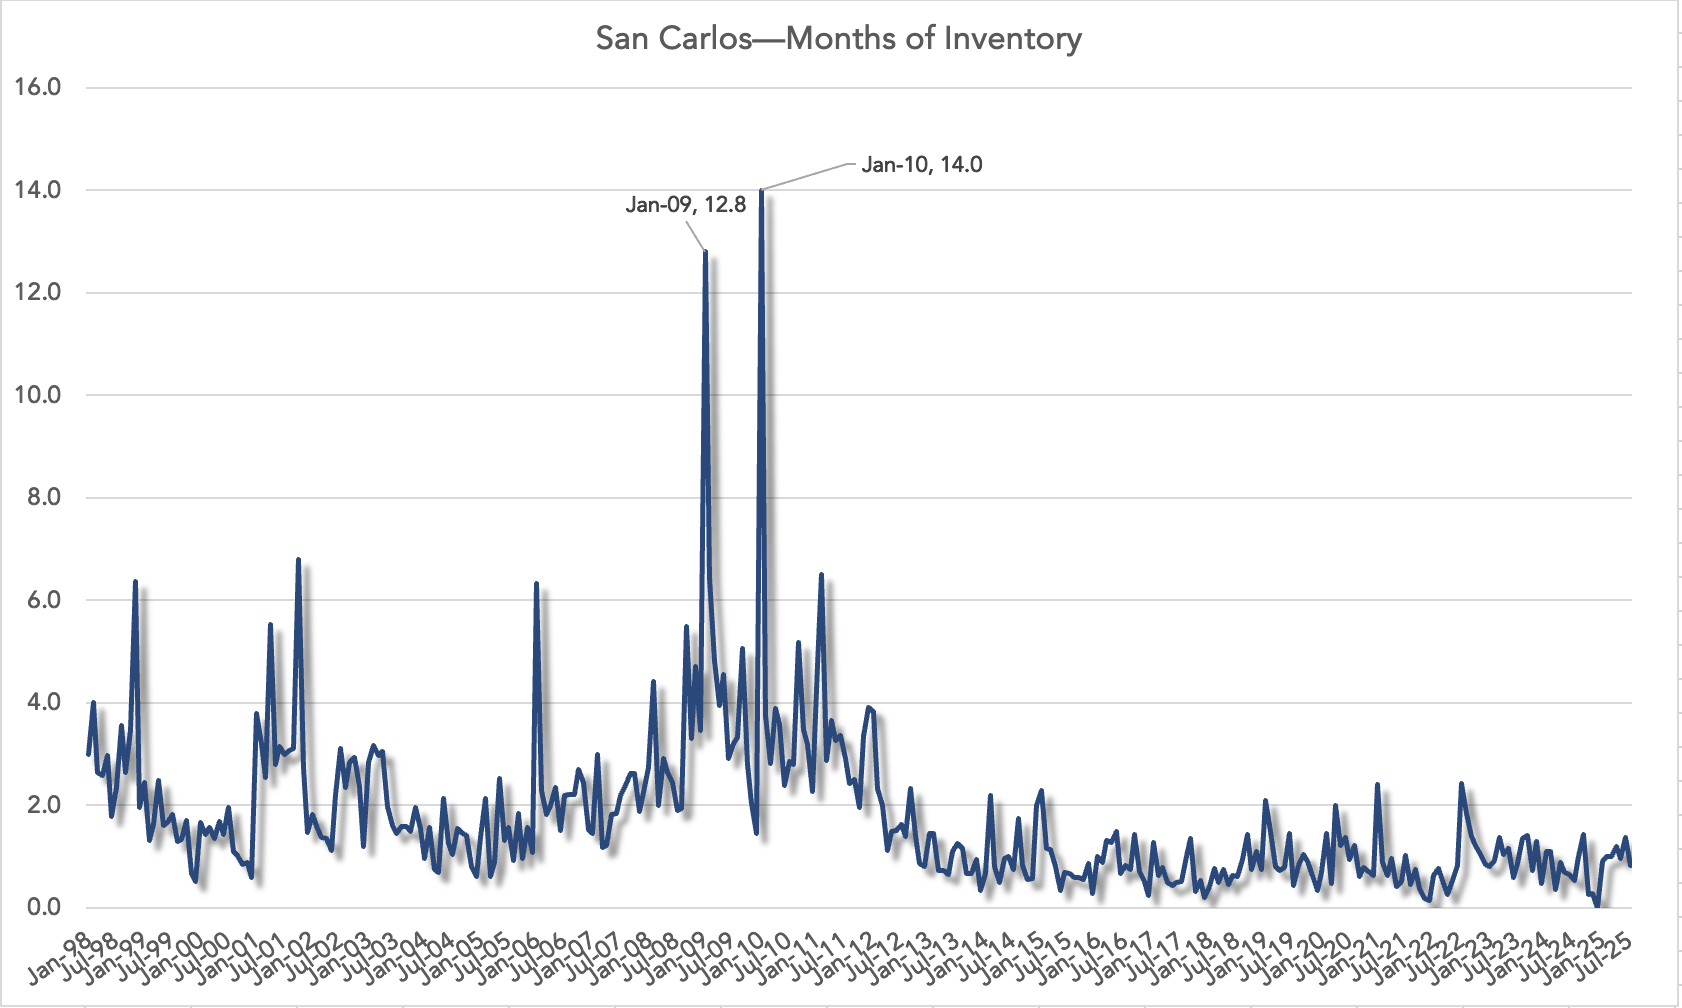
Both of these groups faced similar dilemma, as they could either no longer afford to own their home, or it no longer made financial sense. Forced with foreclosure, the need to sell, or the desire to liquidate, the market was flooded with the mortgage carnage crisis as evidenced by the staggering inventory levels.

Areas that were hit hard and will continue to see a downturn in values in 2008 have the following in common:

·         Rampant growth spawned by increased demand

·         Speculative ownership

·         Over development of new housing projects

·         Room for expansion into new developments and housing units

·         An abundance of sub-prime loans

This is precisely why the Peninsula should fare better than other areas.

·         There is little room for expansion

·         Few new development has occurred in the past five years as compared to areas with growth potential

·         High paying jobs are plentiful

·         Low rate of speculative ownership

·         Few sub-prime loans

Of course not to be overlooked or under appreciated is the desire to live in the technologically and culturally rich Bay Area.

However, it’s entirely possible we are on a precipice which could collapse at any time. What is impacting the Peninsula is the rising cost of energy–especially gasoline. What could have an incalculable impact would be a prolonged recession and loss of local jobs; either of these would undoubtedly bring a decrease in home values to the Peninsula. So much of the values in the Bay Area rely on the perception that it’s a great place to live. A natural disaster (such as a large earthquake) or terrorist attack would also have a detrimental economic effect on housing. Buyers who are sitting on the sideline and not availing themselves of the current conditions are essentially betting on any one of the former conditions manifesting in the near future.

Who’s buying a home right now? With appreciation levels essentially stalled for the time being, savvy investors will take advantage of other’s misfortunes and home buyers previously priced out of the market will seek opportunities in the less competitive market conditions.

New Year’s Day. Why January 1st?

Why do we celebrate New Year’s Day on January 1st? For the same reason the sun never came up in Brittan for 12 days back in 1784—calendars.Champagne_2

On September 2, 1752 the good people of England went to bed and when they awoke it was 12 days later. The sun never came up during those days—no newspapers were printed, no one died and no one was born. What happened to freeze time for 12 days? It was the British Calendar Act of 1751, which declared the day after Wednesday the 2nd of September to be Thursday the 14th.

The reason for the correction was that Brittan continued to use the Julian calendar well after many countries had switched to the Georgian Calendar we us today. Hence the official British calendar differed from most of continental Europe by 11 days. That meant that September 2nd in England was September 13th In France.

The Julian Calendar, named after Julius Caesar who requested its creation in 45 B.C.E, consisted of 11 months of 30 or 31 days, and a 28 day February—to include an intercalary day every fourth year. This calendar only varied from a solar year by about 11.5 minutes each year. By the sixteenth century though this variation had the effect of putting the Julian calendar behind the true solar calendar by 10 days. Pope Gregory VIII advanced the calendar 10 days in 1582 and adopted the Georgian Calendar. Several other key changes were made including the first of the year would begin on January 1st, not March 25th.

But protestant countries such as England were reluctant to make these changes resulting in a difference between British colony calendars and that of some European countries of 11 days by 1752.

There were other hold-outs. Germany and the Netherlands did not agree to adopt the Gregorian calendar until 1698. Russia waited until after the revolution of 1918, and Greece did not weigh in until 1923.