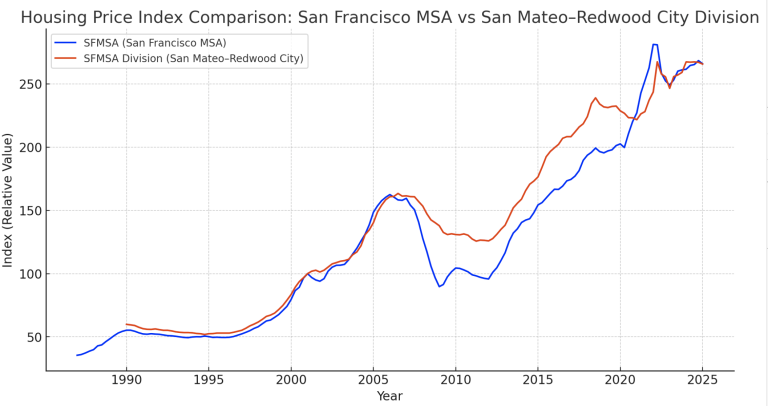
Bay Area Housing Showdown: San Francisco Metro vs. the Peninsula
Until recently, the famous Case-Shiller housing reports lumped the entire Bay Area into the San Francisco MSA—covering Alameda, San Francisco, Marin, San Mateo, and Contra Costa. That broad view smoothed out some of the ups and downs, but it also mixed fast-growing markets with slower ones.
As the population pushed past 2.5 million, analysts carved out a new sub-market: the San Mateo–Redwood City Division, which focuses more on the Peninsula. While this still includes some underperformers (like Daly City and South San Francisco), it’s a welcome step toward highlighting mid-Peninsula dynamics.
So how do the two compare?
If you had invested in 1990, the San Francisco MSA would have returned about 8% more than the Peninsula division. But here’s the twist—those extra gains came with more volatility. The Peninsula, while slightly behind in raw returns, offered a smoother ride.
Growth Since 1990
- San Francisco MSA (metro-wide)
- Total Growth: +381%
- CAGR: ~4.6% annually
- San Mateo–Redwood City Division
- Total Growth: +344%
- CAGR: ~4.3% annually
🔑 Insight: The metro-wide San Francisco market slightly outperformed the Peninsula Division in both cumulative growth and annualized return.

📊 Volatility & Cycles
- San Francisco MSA
- Bigger swings during the dot-com bust (2000–2002) and 2008 housing crash.
- More dramatic rebounds in the tech booms (2012–2022).
- Essentially more “leveraged to tech cycles.”
- San Mateo–Redwood City Division
- Tracks very closely but with slightly milder peaks and troughs.
- The Peninsula benefits from strong fundamentals (jobs, income, schools) but didn’t surge quite as aggressively in the big runups.
🏆 Which is the Better Investment?
- San Francisco MSA (metro-wide):
Better for maximum long-term appreciation, but you need tolerance for volatility. - San Mateo–Redwood City Division:
Slightly lower growth, but steadier and less extreme in downturns. Likely better if you prioritize stability and resilience over maximum upside.
👉 In short:
- Metro (SFMSA) = higher growth, higher volatility.
- Peninsula (Division) = steadier, still strong, but slightly less aggressive growth.
Here’s the investment scenario analysis (1990 → 2025) for a $500,000 purchase in each market:
- San Francisco MSA (metro-wide):
$500,000 → ~$2.40 million - San Mateo–Redwood City Division (Peninsula):
$500,000 → ~$2.22 million
📊 Our Interpretation
- Both markets delivered excellent long-term gains.
- The metro-wide San Francisco market outperformed by about $186,000 over 35 years.
- The Peninsula provided nearly the same wealth-building power but with slightly smoother cycles.
👉 In other words, investing in the SF metro as a whole yielded ~8% more wealth by 2025, but the Peninsula may have offered a calmer ride with fewer sharp downturns.
* Note that The MSAD is also a part of the larger MSA data−So in effect the Peninsula market helped the numbers in the San Francisco MSA market.
Drew and Christine Morgan are experienced REALTORS and NOTARY PUBLIC located in Belmont, CA, where they own and operate MORGANHOMES, Inc. They have assisted buyers and sellers in their community for over 30 years. Drew and Christine have received the coveted Diamond award and ranked among the top 50 agents nationwide and the top 3 in Northern California by RE/MAX. To contact them, please call (650) 508.1441 or emailinfo@morganhomes.com.
For all you need to know about Belmont, subscribe to this blog right here. You can also follow us on Facebook and on Twitter.
This article provides educational information and is intended for informational purposes only. It should not be considered real estate, tax, insurance, or legal advice; it cannot replace advice tailored to your situation. It’s always best to seek guidance from a professional familiar with your scenario.
BROKER | MANAGER | NOTARY


