How to Pay Less Property Tax By Carrying Your Tax Base

If you’ve thought of moving but are frightened at the prospect of your property taxes increasing we have a few propositions for you—60, 90 and 110. You may already be aware of these but we have some new information which might make them more attractive.

Most homeowner’s are keenly aware that buying a new home means having their property tax base increased to 1% of the purchase price. For those of you who have owned a home for many years this alone can make a move financially impossible; for many, it means they couldn’t afford to buy the home they already own.

A BRIEF HISTORY

Proposition 60 enacted into law in 1986 allowed for the one-time transfer of your current home’s tax base to a replacement property of equal or lesser value after the age of 55 of either spouse, providing that the replacement property was located within the same county.

Proposition 90 passed by the legislature in 1989 allowed counties to voluntarily extend the transfer into their county to all 58 California Counties.

Proposition 110 passed in 1996 extends this relief to permanently disabled people, whether 55 or not.

The problem for most people wishing to benefit from this tax base transfer is they are limited to moving within the county in which they currently reside, or moving to one of only a handful of reciprocal counties (Alameda, Los Angeles, Orange, San Diego, Ventura, San Mateo, and Santa Clara).

Fortunately, another very desirable county in the Sierra foothills was added to the list—El Dorado. Their legislature passed a resolution into law on December 10th 2009 taking effect February 15th of 2010 allowing anyone in the 58 California counties to transfer their tax base to El Dorado County.

There are rules you must follow or your transfer will be denied so before you consider a move you will want to read several of the helpful publications which exist, and/or consult with your tax or legal advisor. The State Board of Equalization offers some easy to understand  “Question and Answer” publications as well as a pdf containing many test case scenarios.

If you’ve been holding back on making a move to retain your home’s current tax base it’s nice to know you now have some great options. And if you’re not familiar with this Gold Rush era county, you owe it to yourself to check it out.

There are many cities within El Dorado County which offer a great quality with life. Located around Folsom Lake with its endless water activities, El Dorado County extends all of the way to South Lake Tahoe. The many towns in between including Placerville,  offer affordable housing options—from award winning retirement communities to cities catering to the first time buyer and neighborhoods that rival homes the Peninsula has to offer—including Hillsborough—all at a fraction of what it costs to live in the Bay Area.

Visit the on-line version of this newsletter at MorganHomes.com and use the underlined links in this article to read more.  If you are not comfortable with the internet, simply give us a call and we’ll mail you out some more information.


Disclaimer:

Drew & Christine Morgan are REALTORS/NOTARY PUBLIC in Belmont, CA. with more than 20 years experience in helping sellers and buyers in their community. They may be reached at (650) 508.1441.

The information contained in this article is educational and intended for informational purposes only. It does not constitute real estate, tax or legal advice, nor does it substitute for advice specific to your situation. Always consult an appropriate professional familiar with your scenario.


Can San Mateo Survive a Tidal Wave?

San Mateo County Market Snapshot–Are We Treading Water?   

Those of you who follow our market updates know we put our hometown, Belmont, under a market microscope every month to get a glimpse as to where the market appears to be headed.

Of course that really is living in a Petri dish when it comes to the real estate market as a whole.

Real estate is very local—what goes on in even one part of a city could be entirely different from another. That said eventually positive market trends trickle down and negative ones up.

As evidence of this phenomenon one can go back and look at our charts from 2007 when Palo Alto was still doing famously yet Daly City may as well have slid into the ocean (many homeowners probably wish it had).


Today we visit the numbers—year over year—for San Mateo County as a whole, hoping to see some trends that will give us an inkling as to where consumer sentiment is, as reflected in sales, median price, etc.

SALES

New Listings

Current Inventory

Closed Sales

Average DOM

Average Sales Price

Median Sales Price

% LP Rec'd

Total $ Vol

 2011   545

1400

233

74

786,509

587,500

96.48

182,470,145


2010   484

1156

229

82

840,235

650,000

97.17

192,413,866

2009   530

1452

163

74

683,900

553,750

97.20

110,791,806


It’s easy to see that the ripples of consumer uncertainty could easily capsize the boat of recovery if the tides of low interest rates come in too fast. Cast-of-gilligans-island

Sales are certainly better than the low of 2009 and remain steady as they did in our Belmont example. But as in the Belmont report the median price showed a decline in home values since last January. That’s not necessarily a bad thing, especially if you are a potential home buyer and it doesn’t mean values are still dropping, just that they did drop year over year.

Interest rates are going up, and have done so rapidly in the last few months—around ¾ of a point. That hurts the ability for people to qualify for a home and with less demand there’s a potential for prices to decrease further.

But as we cautioned ourselves, we are comparing 2010–a year of government sponsored tax rebates to 2011 without. Let's see if our minnow of a recovery can weather the storm without a life raft.

Thanks for checking back in with us. 

*Data San Mateo County MLS.

Disclaimer: This information is for entertainment purposes only and includes no legal, accounting or real estate advice nor is this response in tended to be specific to your situation-consult a specialist for your specific situation.


Belmont Home Prices Decline Further

We’re only one month into 2011 and already things are interesting.

Belmont home sales in January 2011 remained brisk. There were twelve homes which closed escrow in January, one more than last year but eight more than in 2009.

It appears a small trend has developed indicating January 2009, as suspected, was the low point for real estate.


Glass But we aren’t out of the woods yet. Depending on who’s talking to you—a glass half full or half empty person—we’re either headed into a slow recovery or its lull in the action before a double dip. Never mind the glass is completely empty person—they’ll always be waiting for the “right time” to buy a home yet never do.

The definition of a double dip is when things get worse than they were at the trough of a business cycle. Considering how bad things were at one point in this last cycle, we find that implausible—that the state of affairs could get worse but hey, we don’t read tea leaves either. Of course that’s not to say things can't remain in a state of unsteadiness for years to come.

Within this recovery there will undoubtedly be micro swings in prices and sales which are highly dependent on consumer confidence, and of course interest rates. The media will predictably pounce on these blips on the radar screen—stay tuned.

January bel 2011

Click on the chart to see a full-sized version. And yes, those are Green Bay colors…

NEW LISTINGS

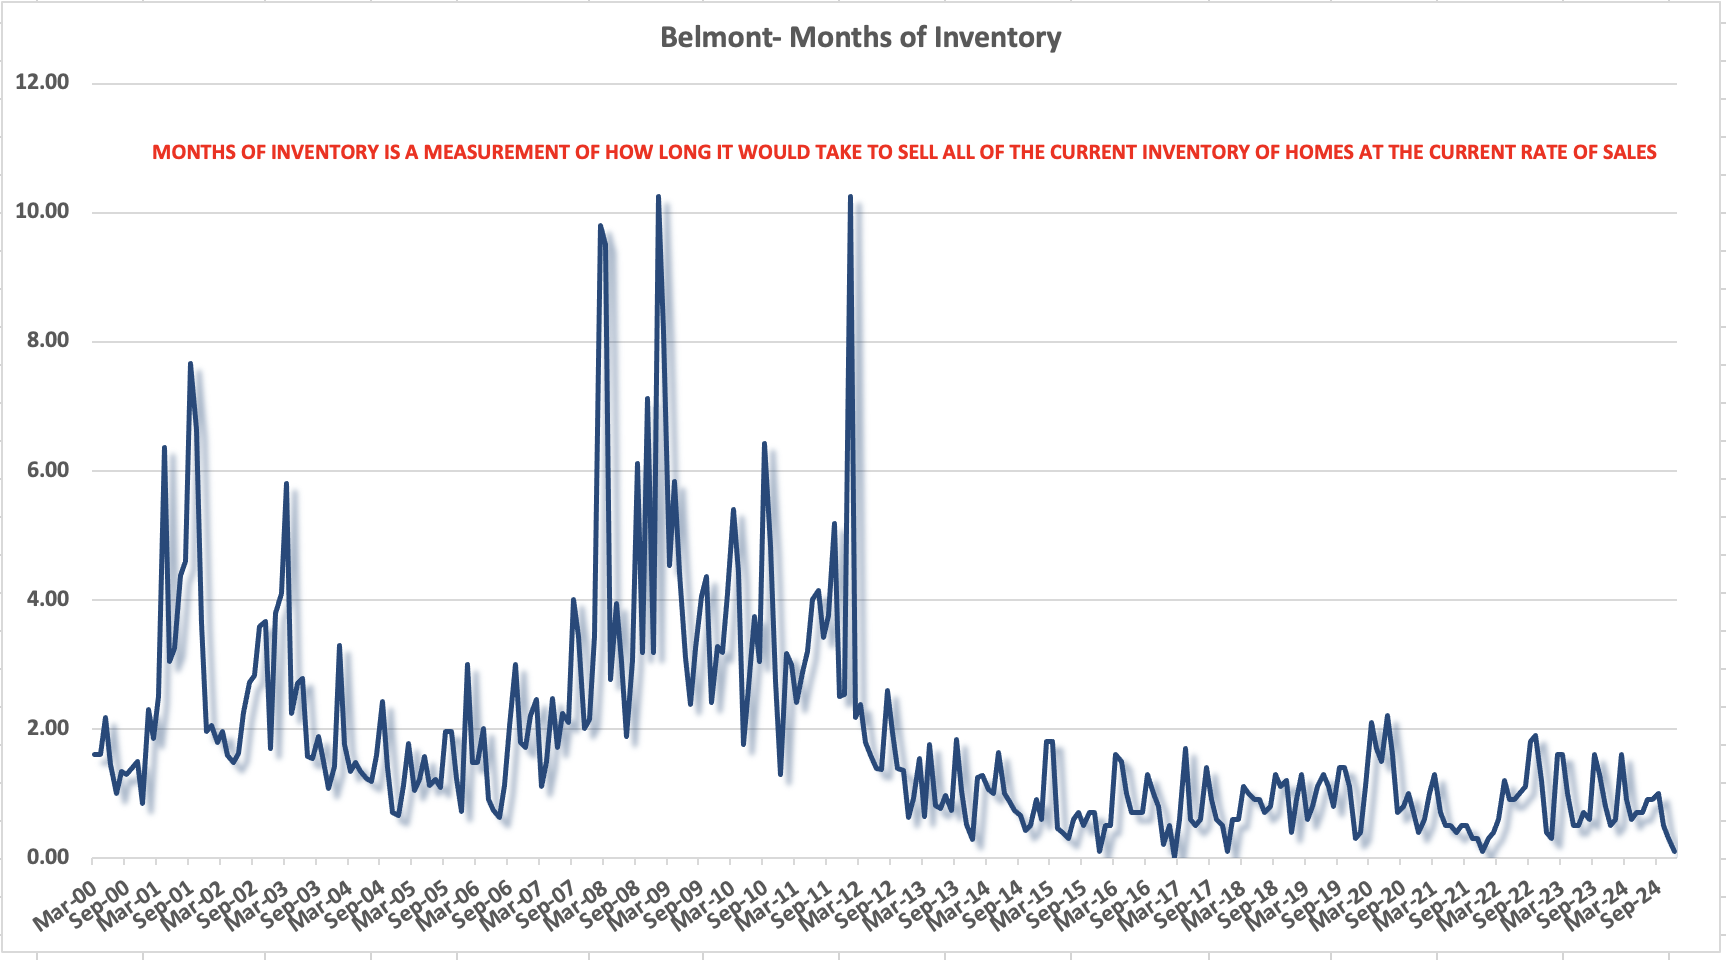
The number of new listings for Belmont in January 2011 stood at 24—six more than in 2010. The inventory levels for these same periods were 38 for 2011 and 35 for 2010.  The more interesting stat is the months of inventory—how long it would take to sell all of the homes at the current pace and inventory levels—a ratio if you will.

In January of 2009 it stood at over 10 months, and the last two January’s have seen that fall to just around 3 months. On a national level the country would be thrilled to see those numbers—the nation is hovering around the 11 month levels—six months defines a stable market.

Why then did prices still fall? Simple. Consumer confidence remains weak.

Sales are on the rise because sellers have become realistic about their home’s value, not because demand has increased. The months of inventory has remained low because many sellers aren't selling their homes. In Belmont, when inventory levels reach more than 50 homes for sale we experience a buyers’ market. Yet with inventory levels currently at 38 homes for sale, why then is it not a seller’s market?

Well the short answer is it is and it isn’t. Seller’s are managing to create a faux seller’s market by listing homes low and creating a bidding war, and keeping inventory levels low (no it’s not a conspiracy it’s just that a lot of sellers either can’t sell or won’t until prices go back up). The truth is buyers can be pickier in some instances; but with inventory levels this low it means it may take a long time to find the home they want.

Did Sellers get their Asking Price?

In January 2011 five of the 12 sellers lowered their asking price by on average $43,000 in order to attract a buyer. In 2010 that number was four sellers for an average of $65,000. Here’s the kicker—in 2010 all 11 homes sold for under the seller’s asking price; for on average $50,000 less, while in 2011 only seven homes sold for less than asking and only $30K (we threw out the one that was ridiculously off base).

So prices are up right? Nope. Sellers are just more sensible.

The median price for a Belmont home in 2011 was $745,000—down from $850,000 in 2010 and the size homes selling in 2011 were a smaller which compounds the difference.

The median size home sold in 2011 was 106 square feet larger than in 2010. This means that even if the median price was unchanged, the size home you could buy for the same money increased 6%. Now let’s factor in the $50,000 median price decline which adds another 5.8% drop in value and you’re looking at almost 12% price decline year over year.

If you are a buyer you need to know that any potential savings you might reap by waiting to see if values decline further could easily be wiped out by an increase in interest rates. Now’s not a bad time to consider getting off the fence…


* Data extracted from the San Mateo County MLS

Disclaimer: This information is for entertainment purposes only and includes no legal, accounting or real estate advice nor is this response in tended to be specific to your situation-consult a specialist for your specific situation.