Belmont’s November housing market for 2012 shaped up like
this:
Belmont home sales were down year-over-year in November of
2012 ending a nine month run of increased sales over last year.
Through November, while there have been 17 more new listings
than last year there has also been 49 more sales, the reason why the inventory
is so low.
Why were there fewer sales this November over last?
A good part has to do with fewer new listings in the last
three months. Remember, sold homes become a statistic only after they have
closed escrow which is typically 30 days after the actual sale. So since there
have been 24 fewer new listings (going back to September), it stands to reason
there would also be fewer sales since there are fewer homes for buyers to
choose from.
Just in the last three months, there have been 83 fever
homes available for sale than in 2011 during the same period. With only ten
homes for buyers to choose from in Belmont this November, we imagine December
sales will also drop off precipitously.
But why are there fewer new listings? Remember the election?
Going back to 2008 we see November had only eights sales—happens every four
years.
MEDIAN PRICE
The raw median home price in Belmont dropped 3.4% over last
year in November from $933,000 in 2011 to $901,500 in 2012. The size home also
dropped though too. In 2012, for 3.4% less, buyers purchased homes that were
14% smaller than last year—which translates into an actual increase of perhaps
10.6% in the median price over last November.
If one looks at the 2,068 size homes sold in 2011 as compared
to the 1,772 square foot homes that sold in 2012 and applies the price per square
foot of $537 that homes sold for towards the differential we get an additional
$158,952, which if added to the median home price of $901,500 gives us $1,061,000
for an adjusted median home price which would be a 13.6% increase year over
year. Of course this is not an exact science to determine the adjusted median
home price, all we are doing is attempting to level the playing field and
understand the trends.
DOM
The time it took a seller to sell their home this November
was 28 days as compared to last year when that number stood at 25—a nominal
change.
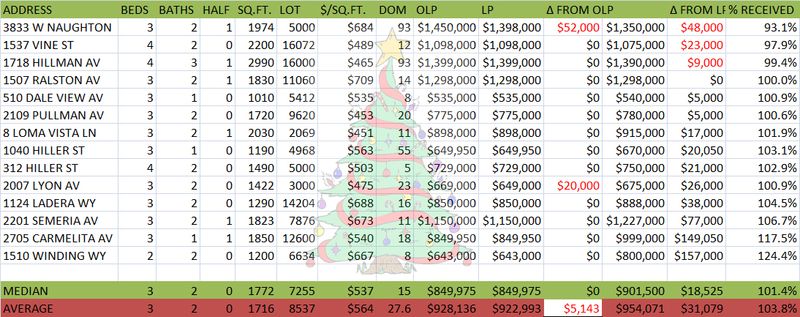
Here’s where it gets interesting
As one can see in this chart, 2012 was a much better year to
be a seller than in 2011.

Looking at this graphic above, one might wonder how if five seller’s received over their asking price in 2011 (for on average $7,000 more)
how could the average they received not be over 100%? The answer is that the
percent received of the asking price is calculated not from the last list
price, but rather from the original list price. So in 2011 there were five sellers
that received over their asking price but not the original asking price. In
other words, at some point some of them had price reductions prior to getting
an offer.
PERCENT RECEIVED
Overall, the percent received in November 2012 was 103.8% of
the seller’s asking price.
The information
contained in this article is educational and intended for informational
purposes only. It does not constitute real estate, tax or legal advice, nor
does it substitute for advice specific to your situation. Always consult an
appropriate professional familiar with your scenario.
Drew & Christine
Morgan did not necessarily participate in these sales.
DRE License Numbers
01124318 & 01174047
Drew & Christine Morgan,
REALTORS | Notary Public (650) 508-1441
All data was retrieved
from MLS Listings, Inc. the Multiple Listing Service for San Mateo County.