October 26th 1881–A Day in History

Each year I post a new message on the anniversary of the “Shoot out at the OK Corral”, and also on Wyatt Earp’s birthday, March 19th (1848).

October 26th bears a lot of meaning for me. Most importantly it was the day my mother was born—and event without which this blog would not exist. My mother was a stall worth advocate of learning and the history that surrounds us. I fondly remember mornings when I would awake to find new message on our chalk-board in the kitchen that recounted some historical trivia—she was the first who said “What happened on this day in history?” It also marks the day of the famous shoot out near the OK Corral.

In 1992 I saw the movie “Tombstone”, and I thought at the time, “What an interesting movie, I wonder what really happened?” That led me on a decade of research into the life and times of Wyatt Earp and the Wild West.  Since then I have read every book I could get my hands on regarding the topic.

WyattKurt *Kurt Russell plays an excellent Wyatt Earp in the 1992 movie Tombstone.

In 1998 I had occasion to meet with several prominent authors of Wyatt Earp history. We met  in Tombstone, Arizona for a trip to recount the facts and places that preceded the shootout as well as that which transpired after the events on that fateful October 26th day in 1881 when the Clanton’s, Mc Laury’s, the Earps and Doc Holliday had it out in proximity to the OK Corral.

The trip was enlightening to say the least, and as is often the case, finding the truth is more fascinating than the Hollywood fiction.

As you’ve probably gleamed the famous shoot out at the OK Corral never really happened at the OK Corral—it was around back in a vacant lot close to Fly’s photo gallery. But who fired the first shot? Those who know for sure are long gone but many believe it was Wyatt Earp—the only one to come out of the fray unscathed. Interesting enough one of the most important details omitted from every movie ever made was the trial that took place after the shootout which could have sent the Earp clan and Doc Holliday to the gallows. There were many witnesses to the gunfight that day and as you can imagine every one of them told a slightly different version of what happened.  In December of that year the trial ended with the exoneration of the Earp’s and Holliday and with that the murder charges were dropped; but the acquittal set off a string of events including Virgil being crippled for life, the murder of Morgan Earp and the bloody massacre of the Clanton gang by Wyatt and his cronies.

For a good book to get a better understanding of the political environment which created the tension in this small silver mining town, I suggest you read a thesis now in book form written by Paul Mitchell Marks titled “And Die In The West”, still in print at Amazon.com.

Belmont Week in Review–Week Ending October 25th 2008

The media continues its relentless barrage of horror stories and down at ground zero people continue to go on with their lives buying and selling homes to fit a lifestyle, not a portfolio.

There are currently 56 Active listings for sale in Belmont down from 58 last week. The six new listings are typical for the last big push before the holidays and the seven homes that went into contract demonstrate the desire to nest before the winter.

NEW LISTINGS

Six new listing hit the market this last week and one of them was ours—we’ll dispense with that one first:

2824 Ext 500 sh  2824 Hallmark Drive, 4 Bed 3 Bath, 2430 Sq. Ft. home LISTED for $1,298,900. Admittedly we are biased about this home not only because it’s our own listing but because we are also neighbors. Hallmark can be a busy street during commute hours but this home backs up to 300+/- acres of the Belmont Canyon open space with hiking and biking trails right out its back door. The orientation of the home is to the rear (as with most Belmont Height's homes) and you can’t get a more relaxing and tranquil setting. What truly makes this home unique is the level rear yard AND awesome canyon (and peek-a-boo) Bay Views. LIsted by Drew & Christine Morgan

OPEN SUNDAY 10/26 from 1:30-4:30 stop by and say hi, Christine and I will be hosting the open house. Here's a cool video tour if you want to get an early glimpse…

2835 Alhambra Drive 4 Bed 2.5 Bath 2,710 Sq. Ft. home LISTED for $1,348,000.

This is the second home to have been listed in as many weeks. Alhambra is a great seclude dead-end street in the Belmont Canyon. This home has seen its share of turn over as we’ve seen it sell several times. This time though it has been updated and shows very well. There’s no level yard out back but it’s a neat home. OPEN SATURDAY & SUNDAY 10/25-26 1:00-4:00. Listed By Philip Watson, Prudential California Realty

3416 Beresford 4 Bed 2.5 Bath 1,810 Sq. Ft. home LISTED for $949,915. Another nice Bay view home and with it, a yard two stories below. OPEN SUNDAY 10/26 1:00-4:30

Listed By Jimmy Chen, Out of Area Office

2949 Monte Cresta 4 Bed 2 Bath 1,670 Sq. Ft. home LISTED for $899,000. Too new to review but it’s open Sunday 10/26 from 1:00-4:00 Listed By Katrin Kaukull, Century 21 Alliance

3901 Christian 3 Bed 2 Bath 1,660 Sq. Ft. home LISTED for $868,000. This is a home where a thousand pictures isn’t worth one word—bad location. Nice home, but bad location. It’s the end home next to Ralston Ave. and every single homeowner and their cars must drive by this home to get in and out of this enclave. OPEN SUNDAY 10/26 1:30-4:30 Listed By Ron J. Bonhagen Sr., Intero Real Estate Services

3414 Beresford 2 Bed 1 Bath 890 Sq. Ft. home LISTED for $649,000. This is a contractor’s special so don’t think you’re getting any real deal here. Be prepared, but if you want a good project it’s OPEN SUNDAY 10/26 from 2:00-4:00. Listed By Rosa De La Rosa, Regency Prime Properties Inc

PENDING SALES

Seven homes went pending last week which is a good sign of overall activity in Belmont’s housing market—more than half were over a million dollars.

SOLD

Monroe â†“ 2037 Monroe 5 Bed 4+ Bath 2436 Sq. Ft. LISTED for $1,199,000 SOLD for $1,167,000 in 68 Days—19 after it was reduced.

This was a very nice home but it was on a smaller lot (4,000 +/-Sq. Ft.). It was remodeled nicely and had Belmont Country Club Canyon views. It was originally listed for $1,279,000 back in August. In September it was lowered to $1,199,000 where it finally received an offer a month after being reduced.

Square footage and/or acreage information contained herein has been received from seller, existing reports, appraisals, public records and/or other sources deemed reliable. However, neither seller nor listing agent has verified this information. If this information is important to buyer in determining whether to buy or the purchase price, buyer should conduct buyer’s own investigation. Information deemed reliable but not guaratneed.

The information contained in this article is educational and intended for informational purposes only. It does not constitute real estate, tax or legal advice, nor does it substitute for advice specific to your situation. Always consult an appropriate professional familiar with your scenario. These homes were not necessarily listed or sold by Drew & Christine Morgan.

When Not to sell Your Home

PODCAST SERIES

Podcast_mic

Real estate markets are cyclical and can last ten years as we’ve recently seen, but even within a cycle there are better times during each year in which to sell.

The short answer is the worst time is in the winter, with the best times being in the spring and fall but here’s why. Psychologically, it appears buyers are more motivated to get a home early on in the year. Writing a huge check to Uncle Sam in April could be one incentive, and fulfilling one’s New Year’s resolutions could be another—both are frequently mentioned. Whatever the reason more buyers come out in the spring and tend to pay more for a home (as a percent of asking) than any other time.

The year’s spring market started off rather unremarkable due to the uncertainty of real estate as a holding while many buyers took (and continue to take) a wait and see attitude.

This graph illustrates the favorable fall selling conditions with the seller receiving a high percentage of their asking price. Notice that in October the amount a seller receives typically bounces back up? We call this phenomenon the “fall bounce” as October sales are consummated in September/October.

That could make this fall a prime time to sell in this year’s cycle. Fall is typically another window of opportunity to sell and obtain the most money for your home and this one appears to be shaping up quite nicely. The market has been rebounding steadily since the beginning of the year, and appears it may crescendo this fall, at least for the year.

We wrote a series on our blog at BeautifulMountainBlog.org about when’s the best time to sell where we analyze the important market indicators to determine favorable selling conditions. Some of which are::

·         The month’s supply of homes for sale

·         The amount a seller received of asking

·         The days it takes to sell a home, or DOM

If you are considering moving this fall we’d be glad to answer any questions you may have about the process.

Download when_not_to_sell_a_home.mp3

Tuesday’s Tour-9/2/2008

Driving Tuesday’s are tour days of agents. We get a chance to see all of the new listings in one fell swoop. Some of these homes have been open the previous Sunday and you may have already seen them. If you haven’t, here’s my update on the Belmont Homes that were in my Weekly Update last week but toured today, September 2nd 2008:

2422 Hastings 3 Bed/ 2.5 Bath 2,250 Sq Ft Attached Home LISTED for $1,038,000. These are attached homes in the Belmont Hills. You tend to get a lot of home for your money but not much land. This home needs some updating. On the plus side it’s an end unit home so you only have neighbors on one side. Nice canyon views from the rear of the home.

1909 Lyon 3 Bed 2.5 Bath 1,600 Sq. Ft. home LISTED for $912,000. This is a nice home with a lower extra room. It’s in move-in looking condition and on a nice quiet portion of Lyon.

2014 Lyon 2 Bed/2 Bath 1,761 Sq Ft Home. I’m skeptical about this home’s reported square footage but nevertheless it’s an excellent deal for a west side Belmont hills location and wins our Best Belmont Deal of the week at only $779,000.

512 Alameda de Las Pulgas 2 Beds/ 1 Bath 1,230 Sq Ft home. Don’t let the busy address fool you. This home sits back on a quiet driveway off of the Alameda. LISTED for $804,000.

Bring your contractor to this home. It’s on a busy street as you know but it does sit way back. I like the older Spanish style architecture it has but that also translates into some much needed work to be done.

Frequently UNASKED Questions–Dual Agency REVEALED!

We begin our series—Frequently UNASKED Questions in a real estate transaction starting with one of the most misunderstood aspects—dual agency. Unasked3

Many web sites offer a link to their frequently asked questions and usually they’re pretty helpful since chances are your questions will be in the top ten. But what about the questions you don’t know to ask?

If you are new to buying or selling a home you may not know the most important questions to ask. We’ve started a series called Frequently Unasked questions to help shed some light on questions which should be asked, but frequently aren’t.

Download the complete Podcast (Download dual_agency.mp3) or subscribe to our feed. We discuss the intricacies of dual agency in a real estate transaction including the potential pitfalls and limitations.

If you’re considering having an agent represent you in a transaction you should stipulate up front how to handle dual agency if it crops up. Most are aware that dual agency happens when an agent represents the seller and a buyer in a transaction but few know that two different agents can still create a dual agency relationship.

What to expect in this Podcast:

·         Explaining dual agency.

·         How one elects or creates dual agency.

·         How to know if you are in a dual agency transaction.

·         How it works—what to watch out for.

·         To whom your agent has a fiduciary duty.

We begin our series—Frequently UNASKED Questions in a real estate transaction starting with one of the most misunderstood aspects—dual agency.

The information contained in this blog and Podcast is educational and intended for informational purposes only. It does not constitute real estate, tax or legal advice, nor does it substitute for advice specific to your situation. Always consult an appropriate professional familiar with your scenario.

Belmont’s Best Deal for May 21,2008

We thought this home was the best deal this week. It’s in a great area of the Belmont hills on the west side. Carmelita is known for having a warm micro-climate. For $699,000 this price is hard to beat. It has a larger than normal rear yard which is level–a rare find in the Belmont hills.

Call us at (650) 508-1441 or email dmorgan@morganhomes.com if you’d like to see this home!

CARMELITA AV, Belmont 94002 (Belmont)
$699,000 Beds: 2 bed(s) Baths: 1 bath(s)

DOM: 5  CDOM: 5   MLS: 809521 

Carm

Property Overview

CARMELITA AV

Belmont (Belmont) 94002

Detached Single Family (Class 1)

Bed/Bath:

2 / 1

SqFt:

1,020

Lot:

5,829 sq ft

Age:

57 years

Assoc Fee:

List Price:

$699,000

Sale Price:

Sale Date:

COE Date:

Remarks

Wonderful quiet location; Darling home! Open, bright with walls of glass revealing quaint covered front porch and private fenced yard; Dining room has been walled off from living room to create a home office; easily re-converted; Updated kitchen! Nearly 6000 sq ft lot! Desirable Belmont Hills!

Schools/Districts

Elem:

–/ Belmont-Redwood Shores Elementary

Middle:

High:

–/ Sequoia Union High

Property Features

Familyroom
No Family Room

Informal Dining Area
No Informal Dining Area

Other Rooms
Bonus Room

Bedroom Descriptions
    —

Shower And Tub
1 Shower over Tub

Shower
No Stall Shower

Other Areas
Extra Storage

Amenities
    —

Fireplace Location
    —

Floor Covering(S)
Hardwood
Tile

Energy Features
    —

Listing Includes
1 Dishwasher
1 Refrigerator
Microwave Oven

Garage/Parking
Detached
1 Car Carport

Lot Description
    —

View
    —

Yards/Grounds
Fenced Yard

Has Pool
No Pool

Pool Description
    —

Pool Options
    —

Style
Ranch

Presented by Christine Morgan, Carlmont Associates, 650-508-1441, cmorgan@morganhomes.com

** Information contained on this report is designed for accuracy but is not guaranteed **

Allow Me to Think Out Loud…

Thinking The San Francisco Chronicle just splashed more bad news about the housing industry all over the front page of the Friday (March 14th) issue. Sales are down-way down. Part of the explanation seems to be that tightening lending standards have made it hard to afford a home since qualifying at artificially low teaser rates is no longer acceptable. Stated income loans are only available for self-employed individuals and Wall Street stopped buying mortgage backed securities so rates are up too.

Of course buyers who have been priced out of the market are now waiting to jump in at the bottom, which only adds to the rapid decrease in sales activity.

Timing couldn’t have been worse for Congress to approve raising the ceiling on federally backed mortgages from $417,000 to $729,950 in the Bay Area. Many buyers considering purchasing a home are enticed to wait out the market a little more to see if rates will drop further.

So if we had a crystal ball, we’d say that when the new higher conforming loan cap goes into effect, it’s just possible that many buyers will get off of the fence. And if they all do that at the same time, there just possibly could be competition once again for housing.  The biggest fear if you’re a buyer is you get in the market too early and your home’s value could go down before it goes back up; that’s a horrible position to be in if you have to sell while it’s down. The alternative is to get lucky and time it perfectly, or wait to see values going up and be assured you didn’t get the best deal. I don’t know for sure, but history tends to repeat itself and I’ll bet home values go up again sometime in our future. While everyone’s trying to guess when the bottom is not everyone will get it right.

Maybe buying before that happens would be a good idea. If rates do go down further, one could always refinance…

Belmont’s Market Report-February 2008

February sales data for Belmont is available but there’s not much to talk about. There were only five sales (homes that closed escrow) in the month of February. That means only five sales were consummated in January. That’s down more than 50% over last year. While that may sound like a huge percent decrease, it’s important to remember in terms of actual units, it means eight fewer homes sold.Graphtrends

The median price decrease could make headlines though. It dropped from $900,000 a year ago to $750,000 for the same February period. Of course with only five sales these numbers are easily skewed. In fact, the median size home which sold in February 2007 was 1,680 square feet in size compared to this year’s five sales where the median size home was only 1,010. That’s more than enough to explain the difference in the median year-over-year price change. If one was to account for this differential at the going cost per square foot the adjusted median price would be $ 1,122,000 for 2008.

In February, the average home took over 40 days to sell and the seller received only 96% of their asking price.

In every category we measure—the time it takes to sell a home (DOM), the number of new listings vs. sales, the percentage the seller received of asking—the performance was markedly down over last year. Yes the real estate market has slowed and if we were to measure it as we do the economy, you could say it’s in a recession.

Bel_208_postcard

How Low Will it Go?

Our best guess is that this housing retraction will be more similar to 2001 than in 1990 which is to say it should be relatively short lived so long as jobs remain plentiful. This means the housing market should level off this year as far as declining sales go. Our feeling is it will be later in the year rather than sooner. We don’t anticipate a "light switch" suddenly going on and people flocking back in droves to the market. The market will probably remain flat through 2009 with sales picking up later that year. That’s the national picture.

On the San Francisco Peninsula, real estate is not suffering from the same issues as many other parts of the state and country. Regionally, the main reason for a slowdown in sales has been tighter lending practices (causing Jumbo loans to be more expensive), low homeowner affordability (due to high prices), and buyer skepticism brought about by the housing issues which dog the industry and has many buyers taking a wait and see approach.

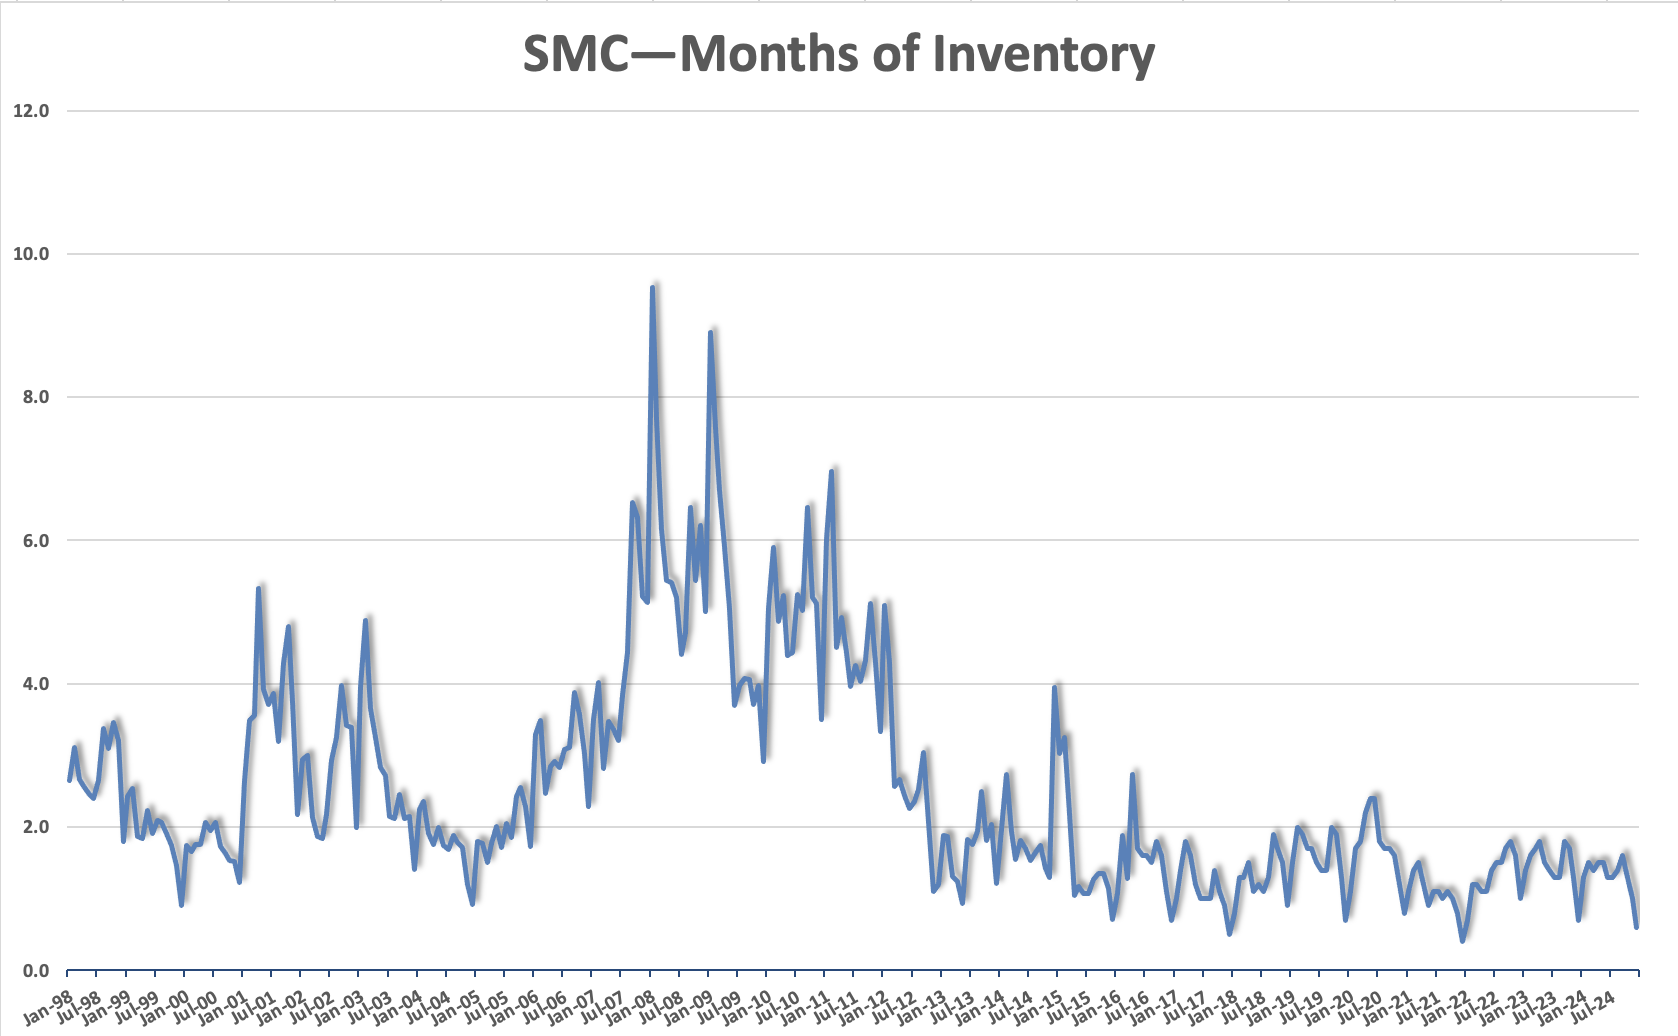
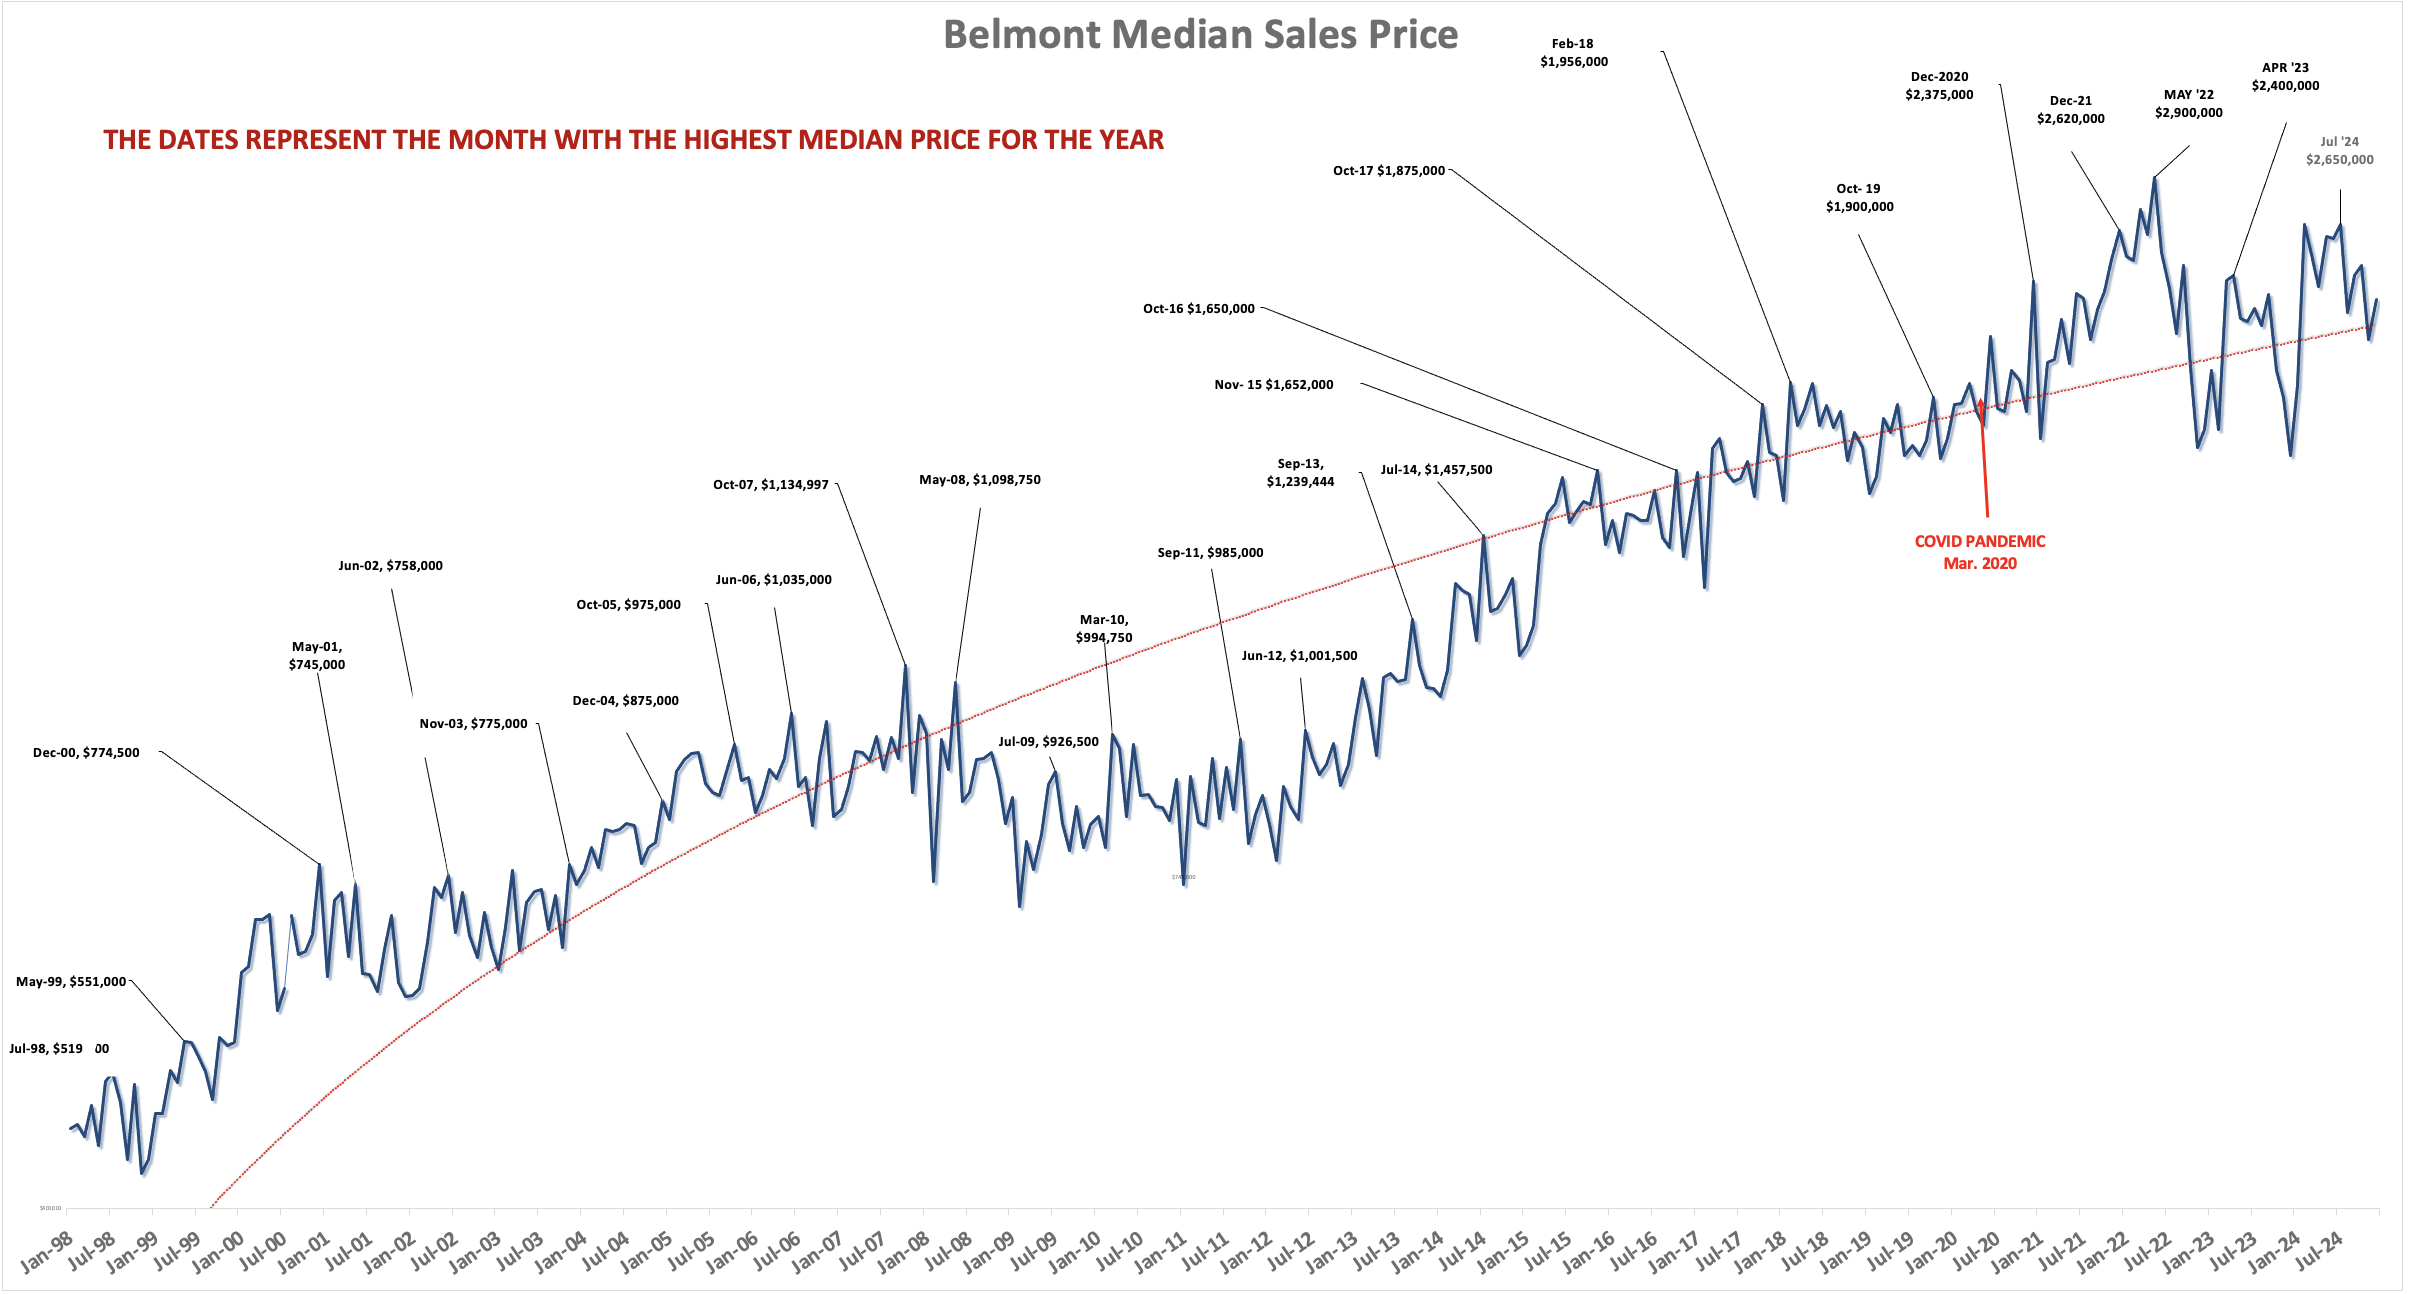
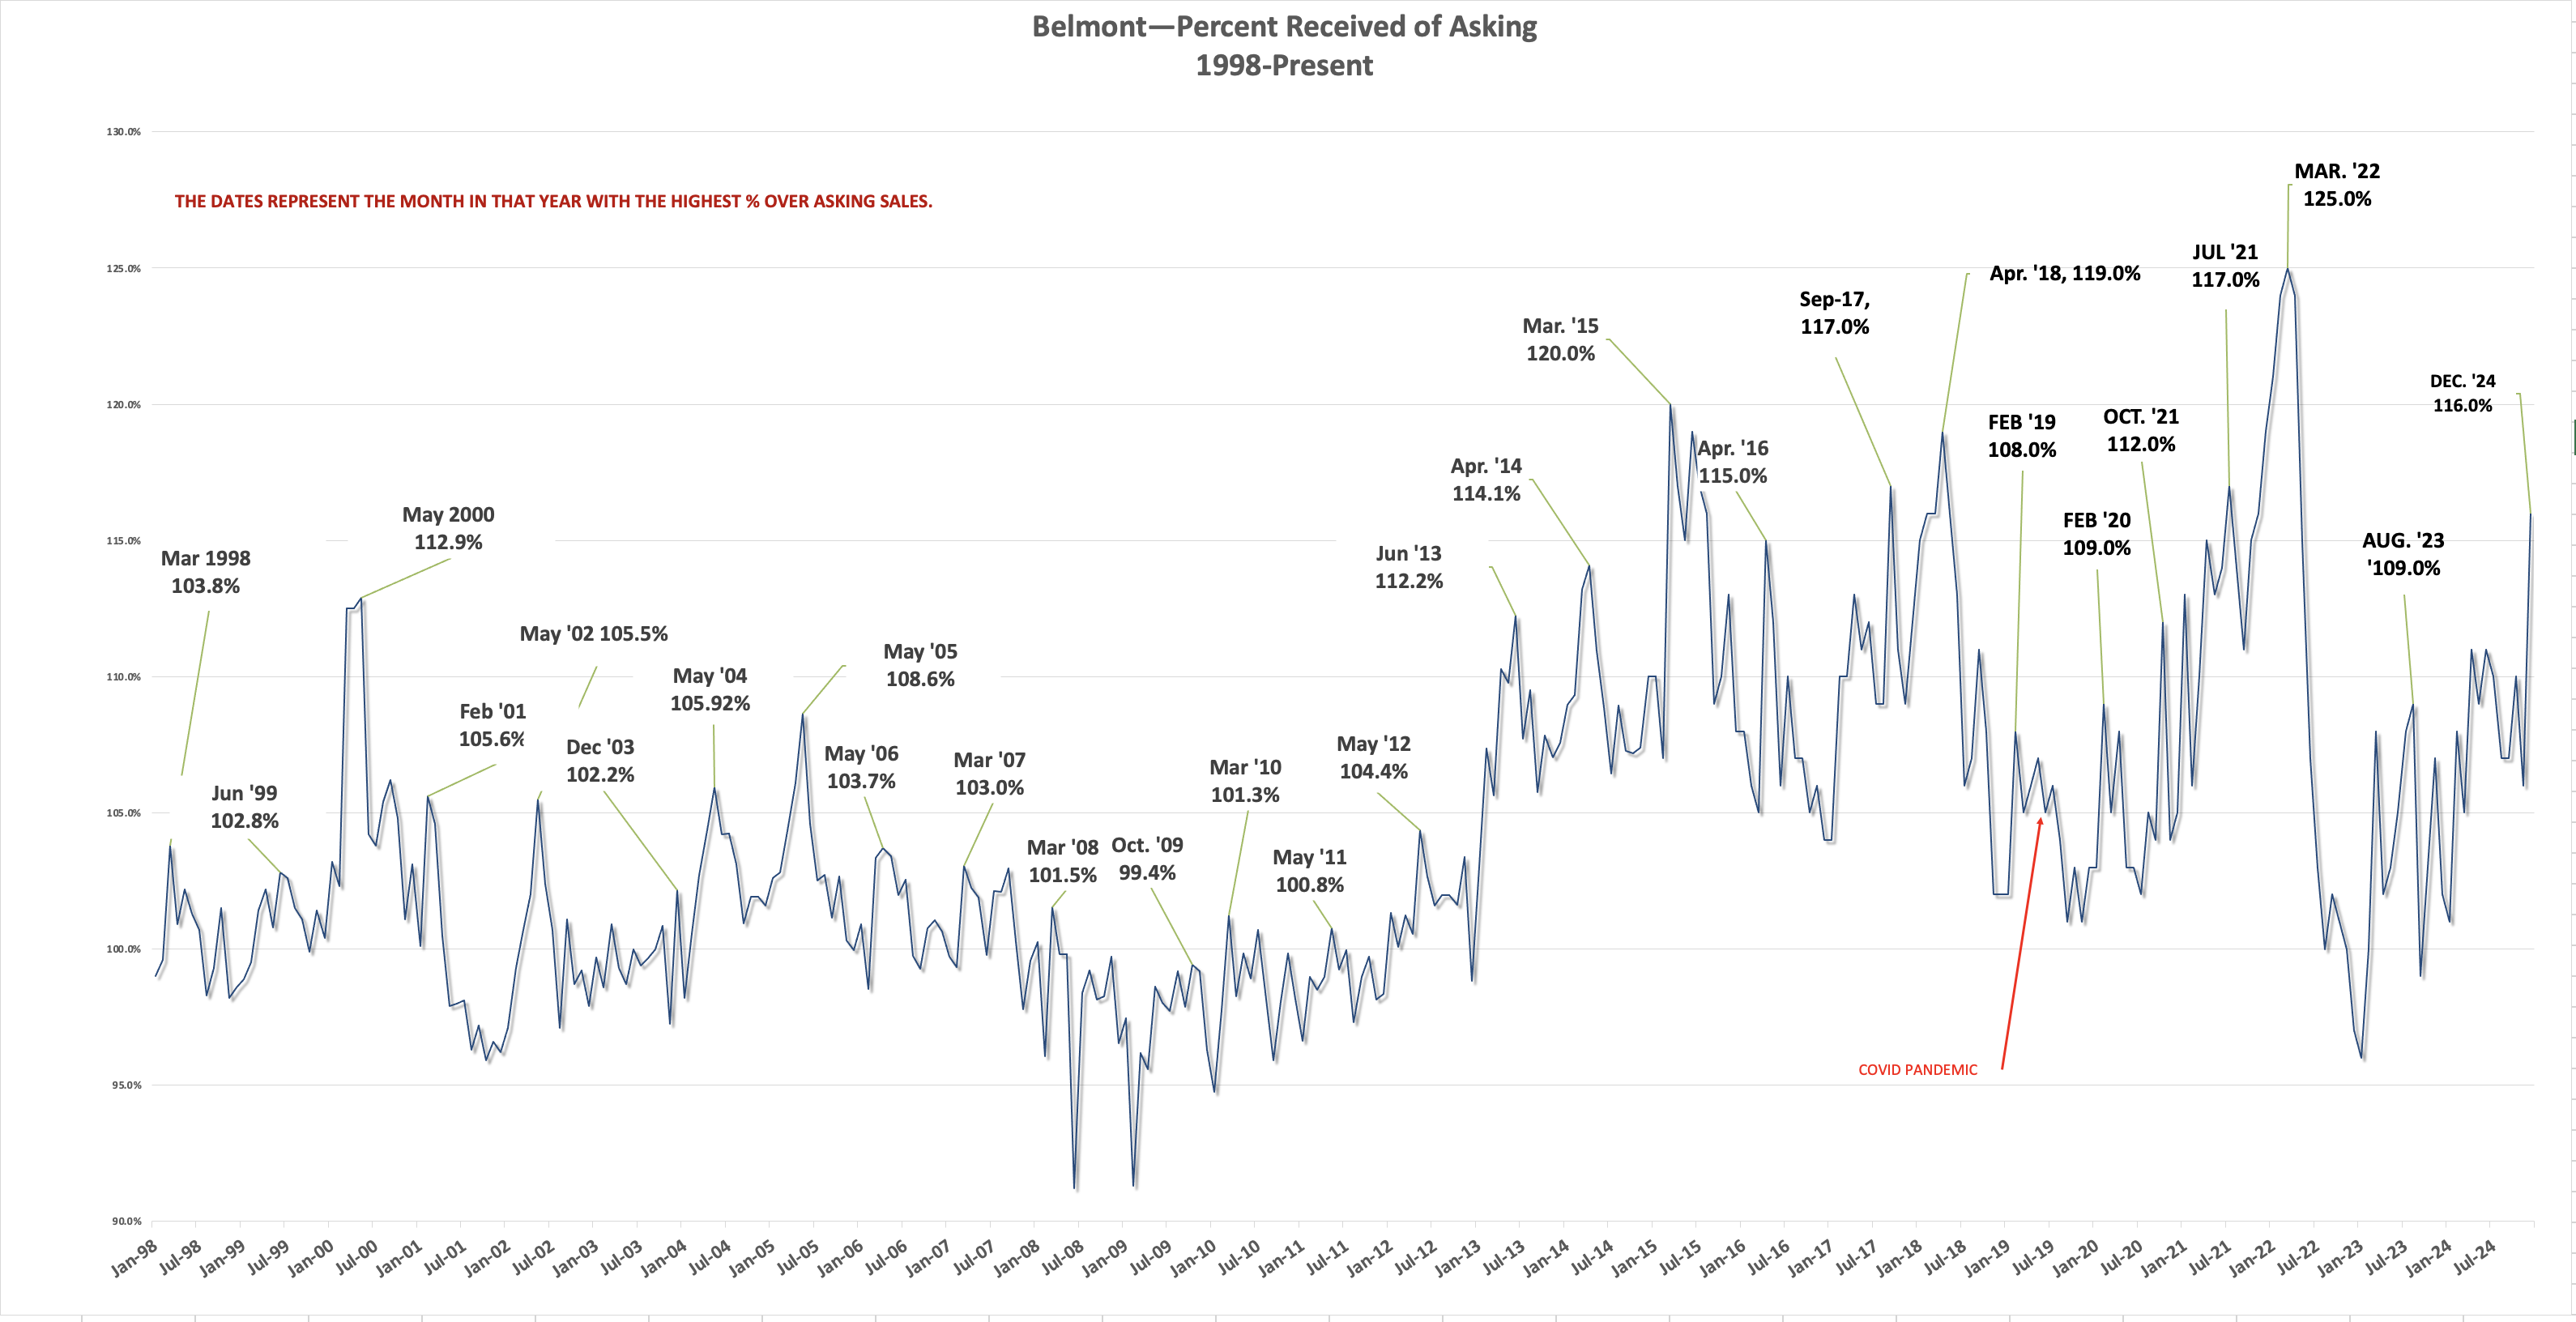
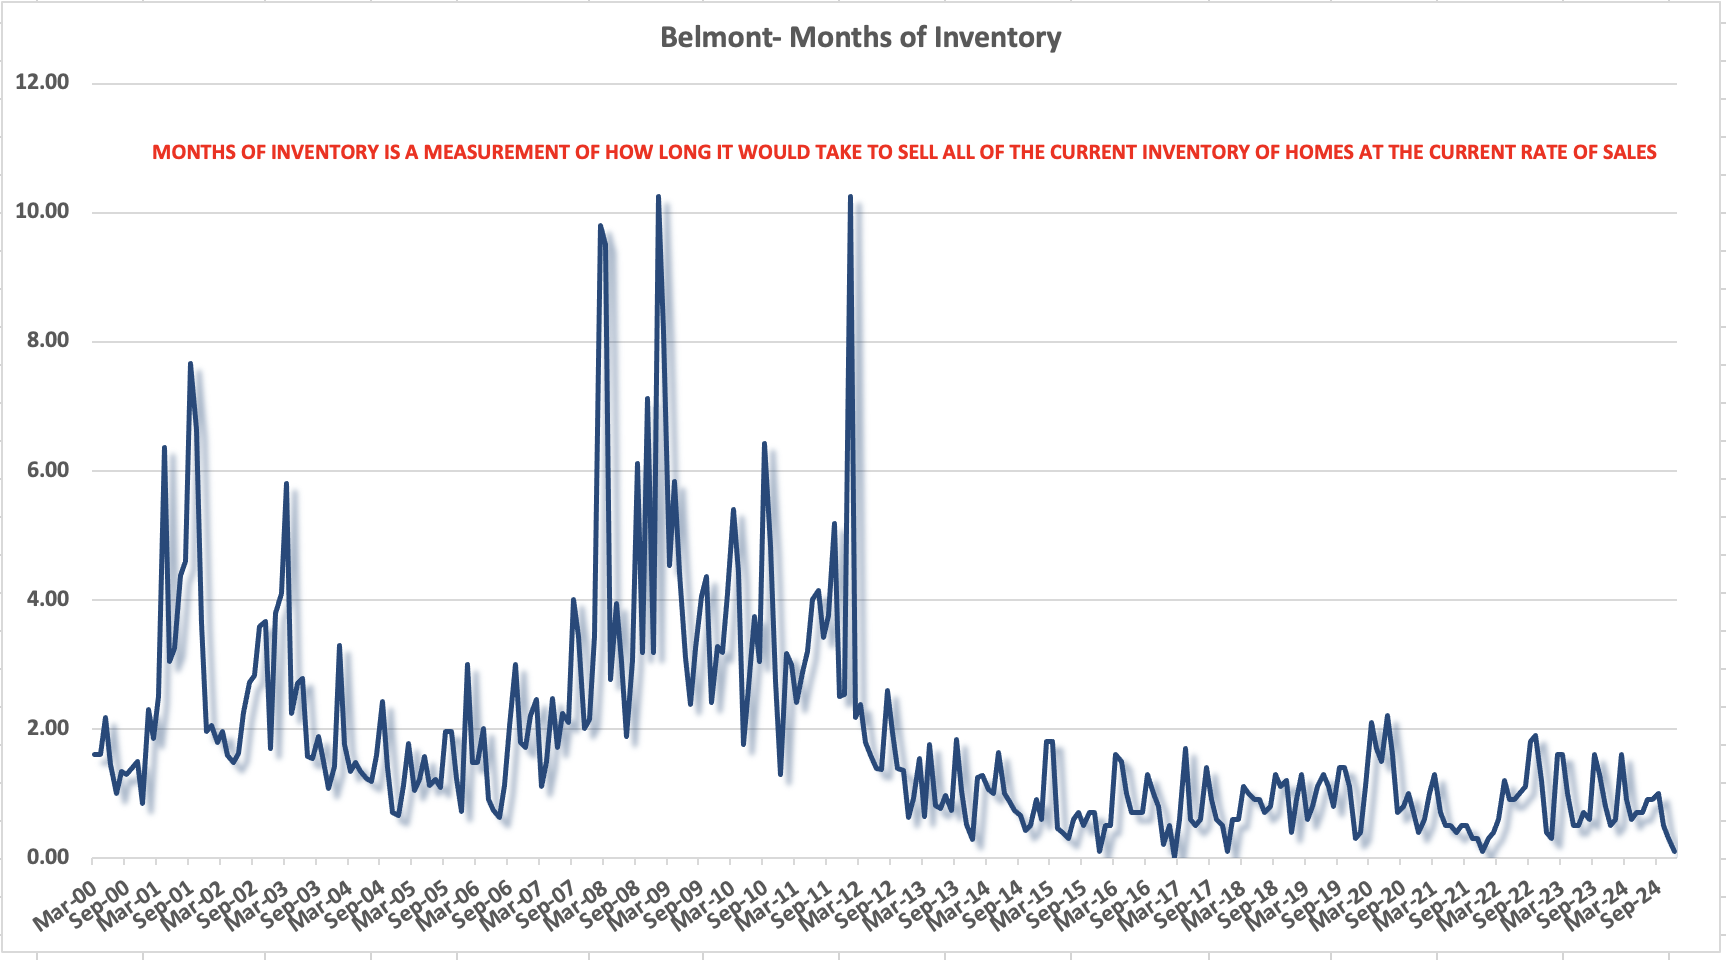
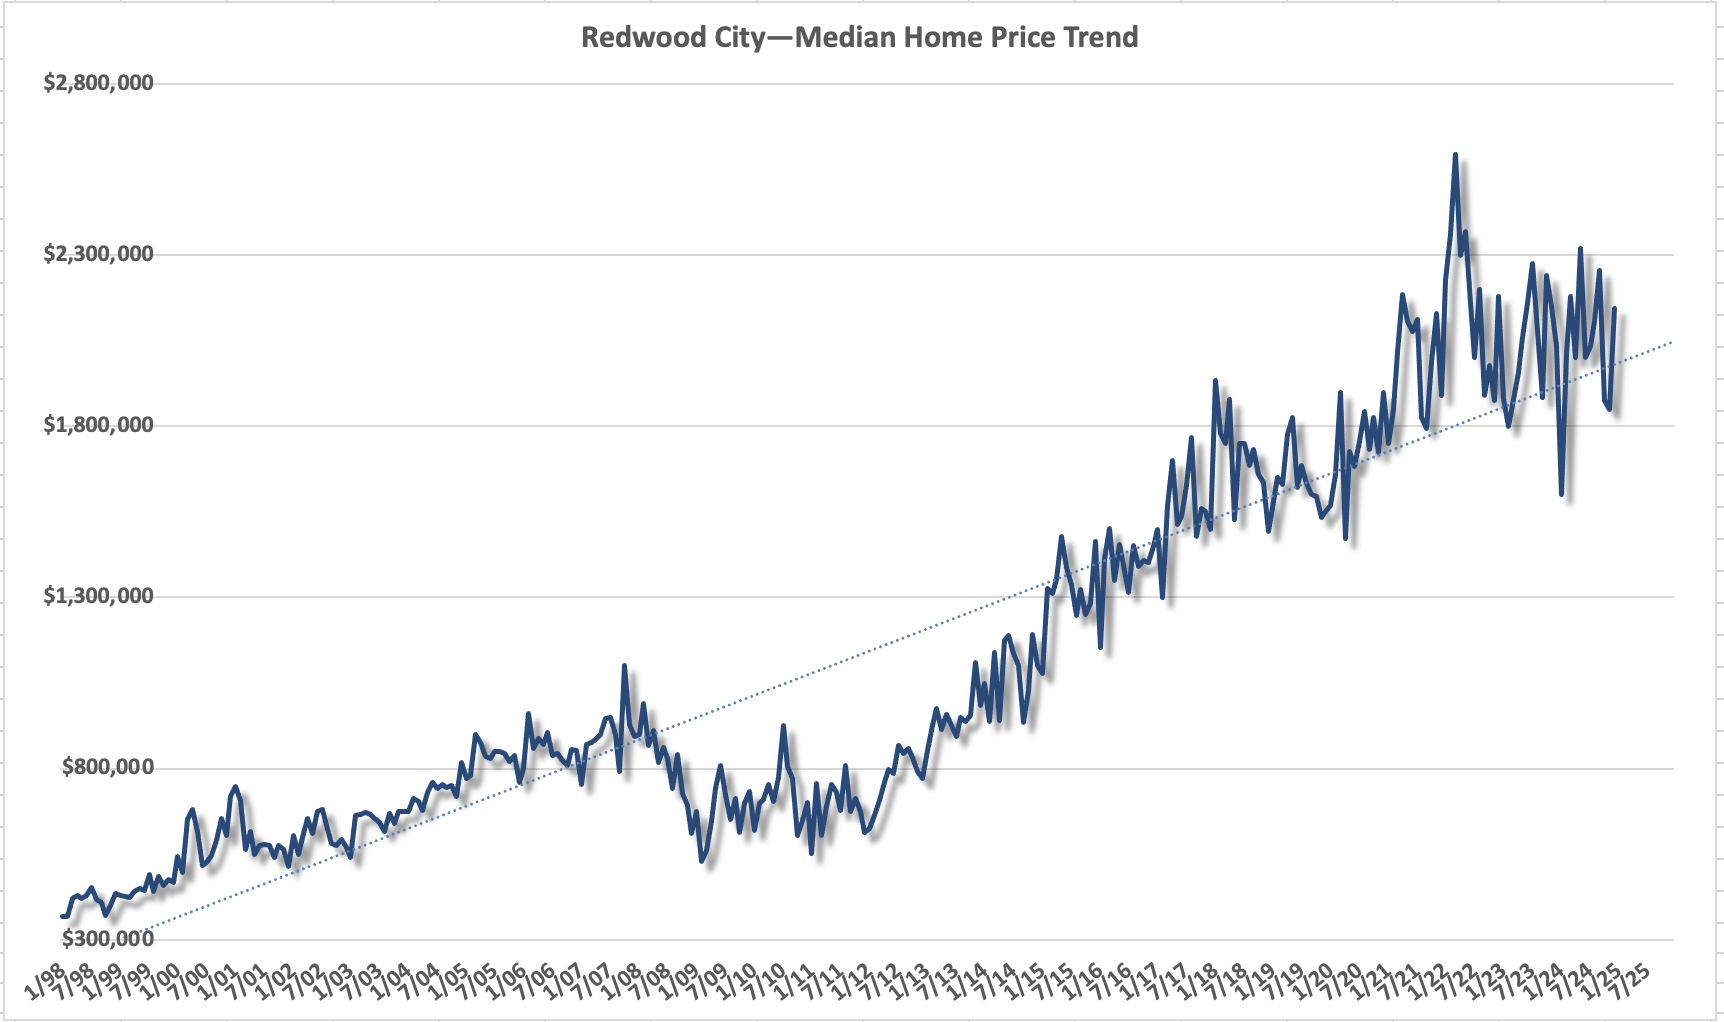
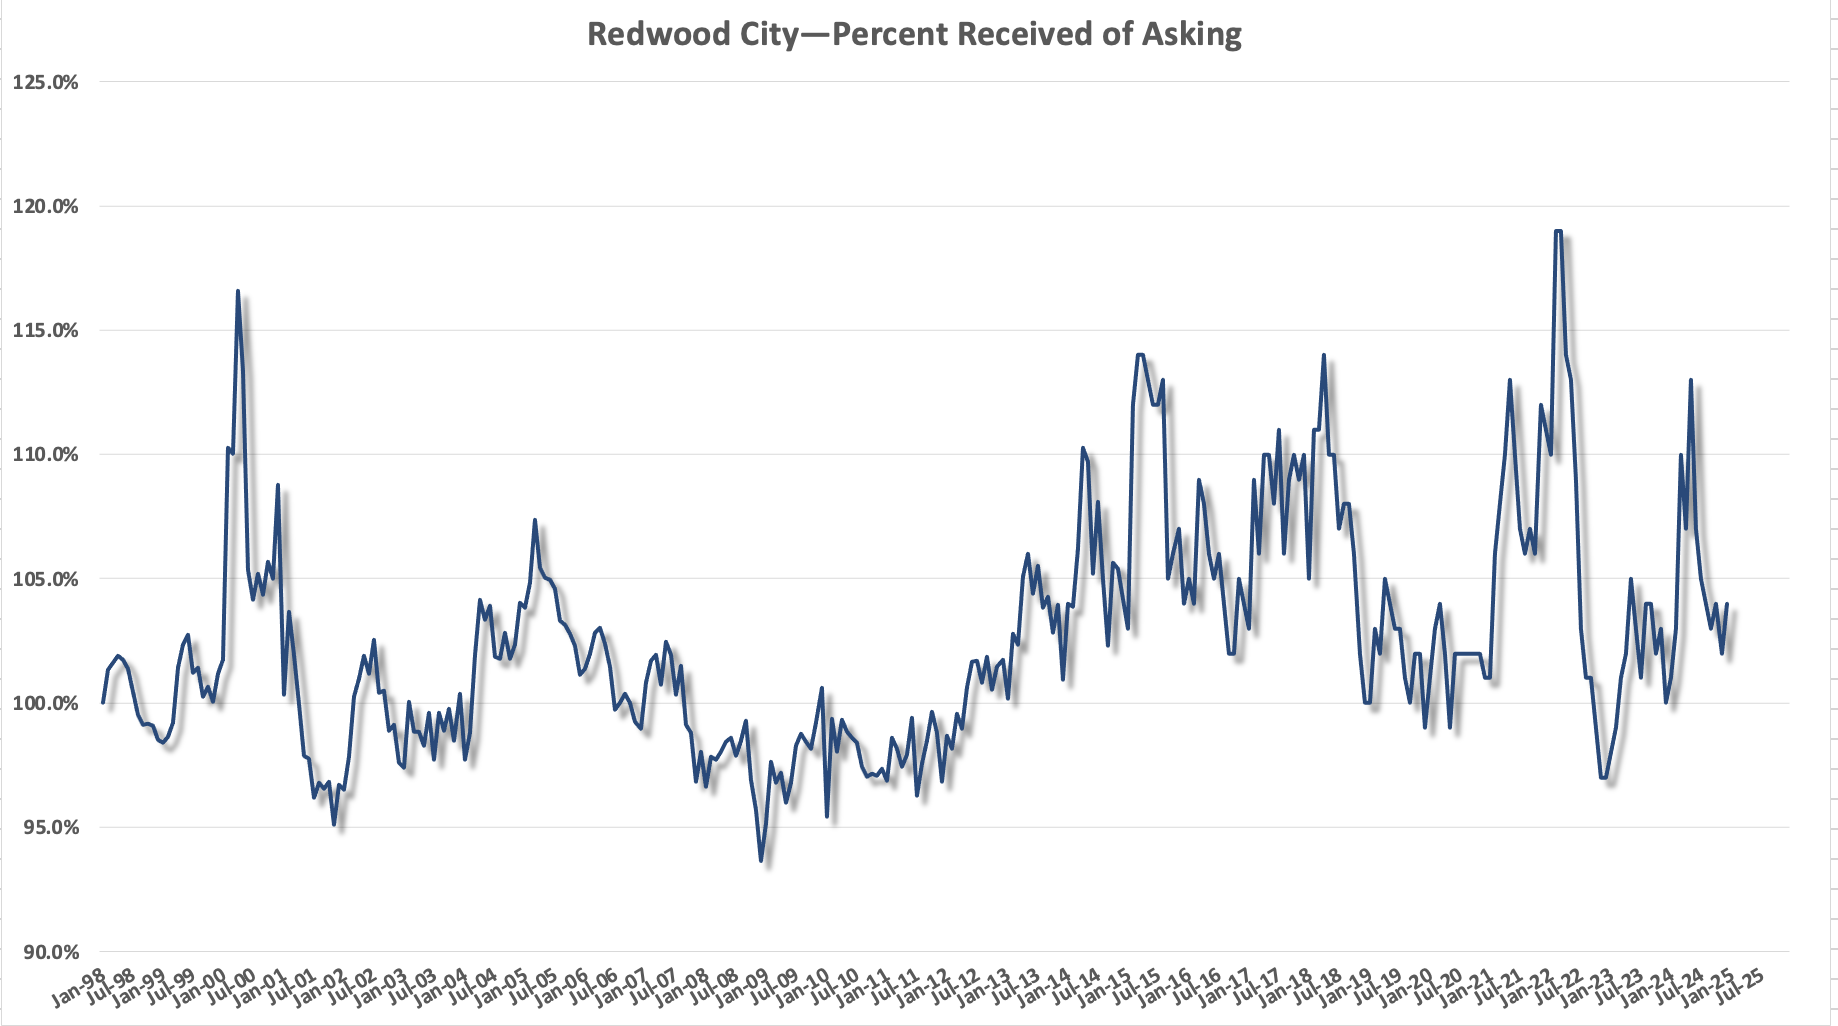
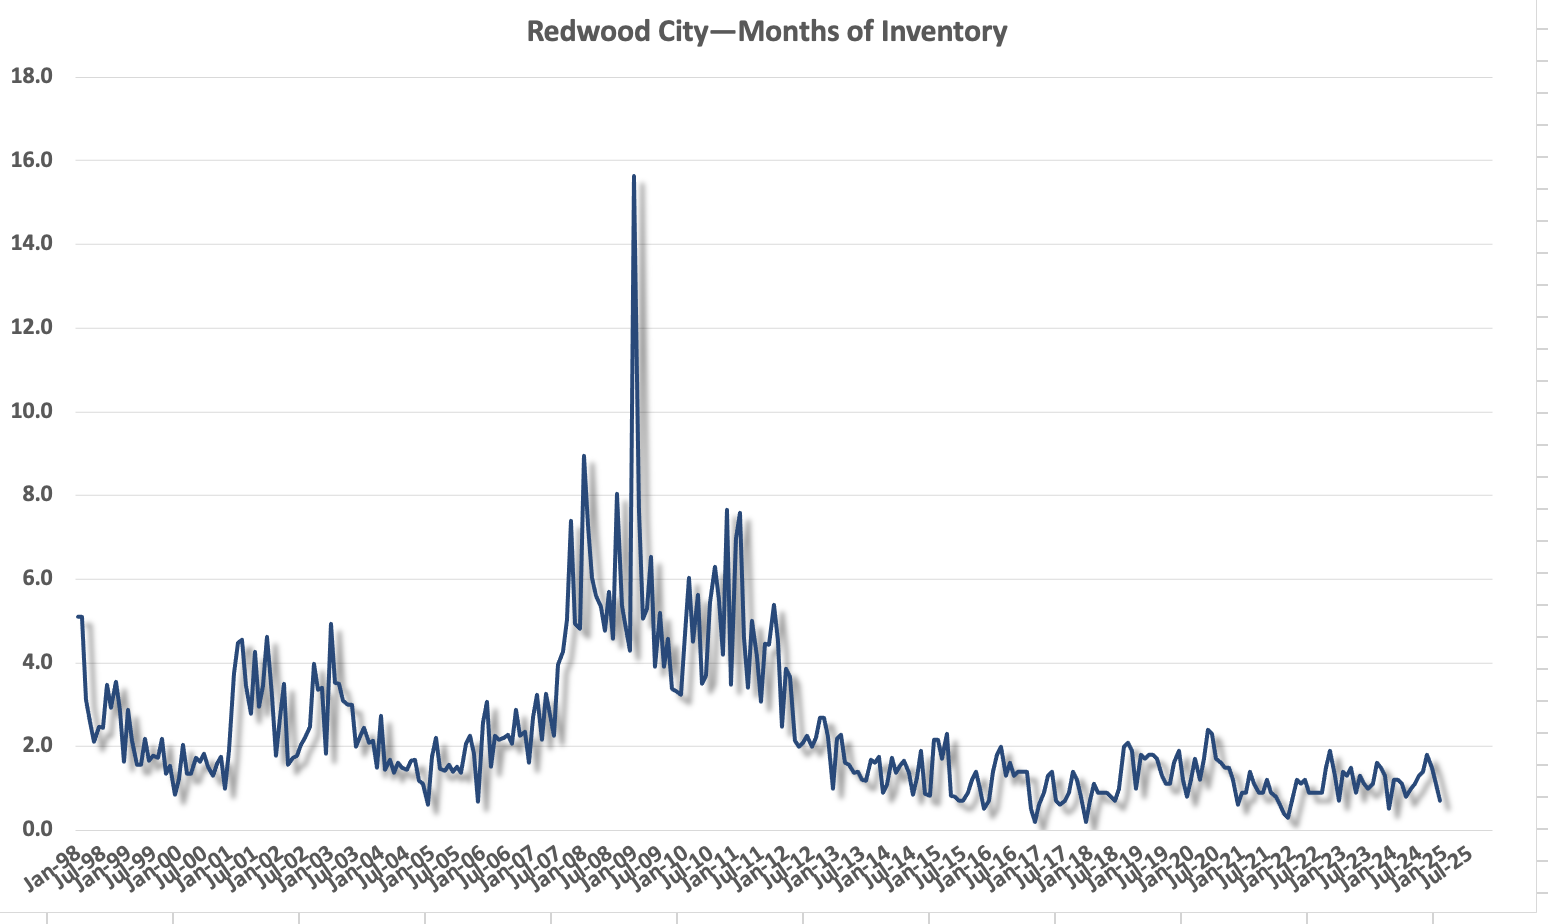
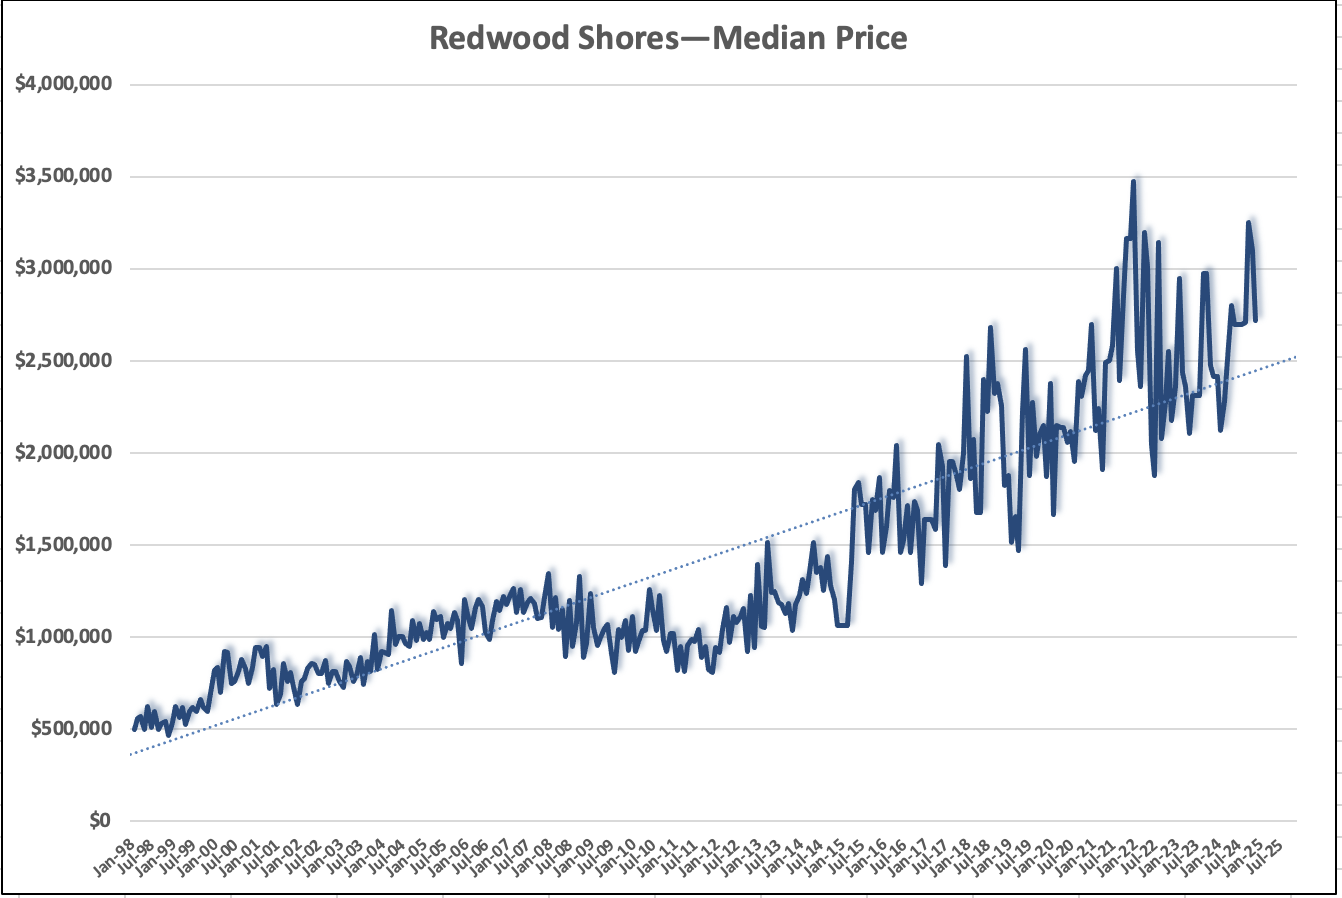
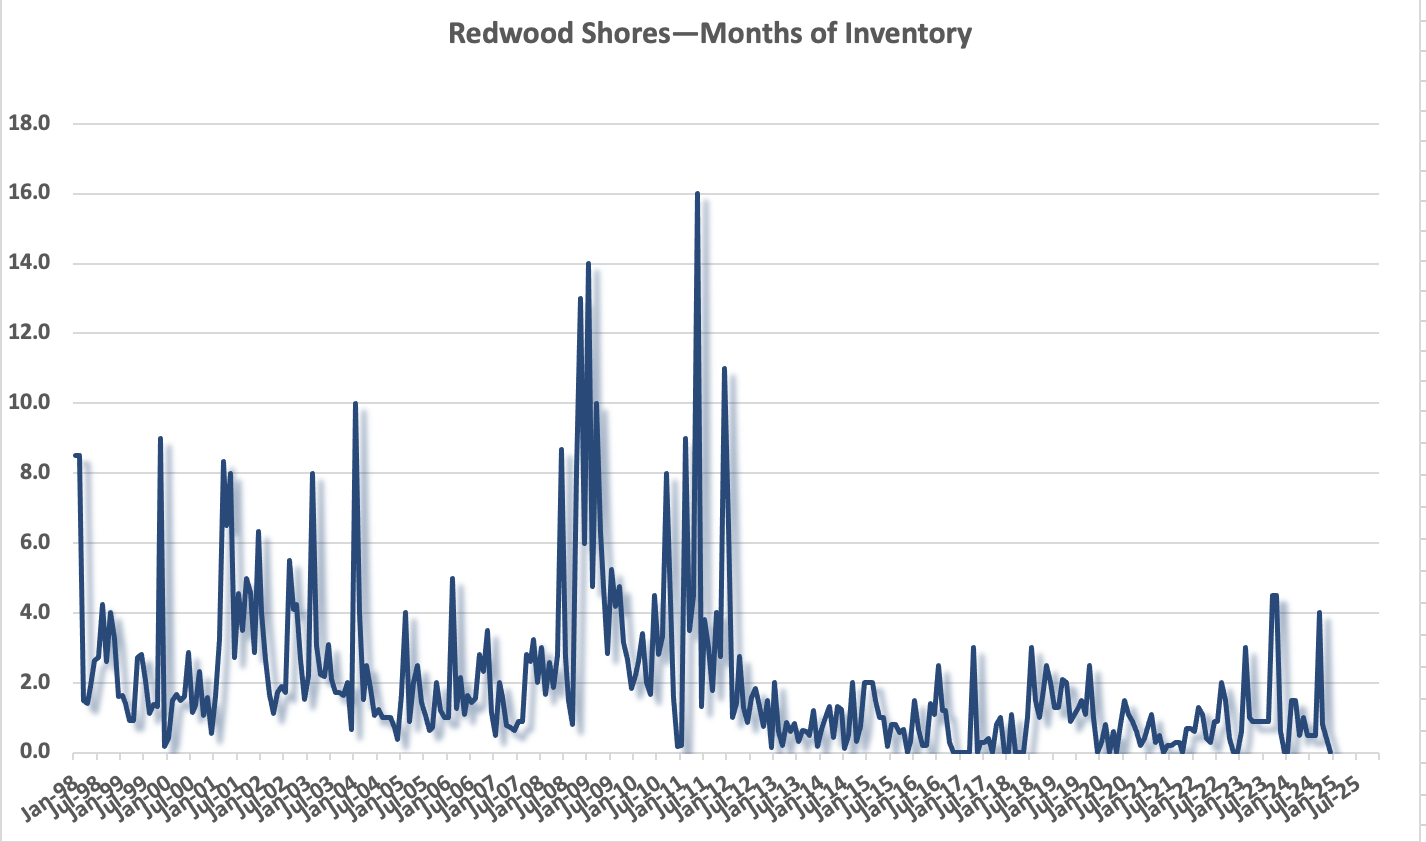
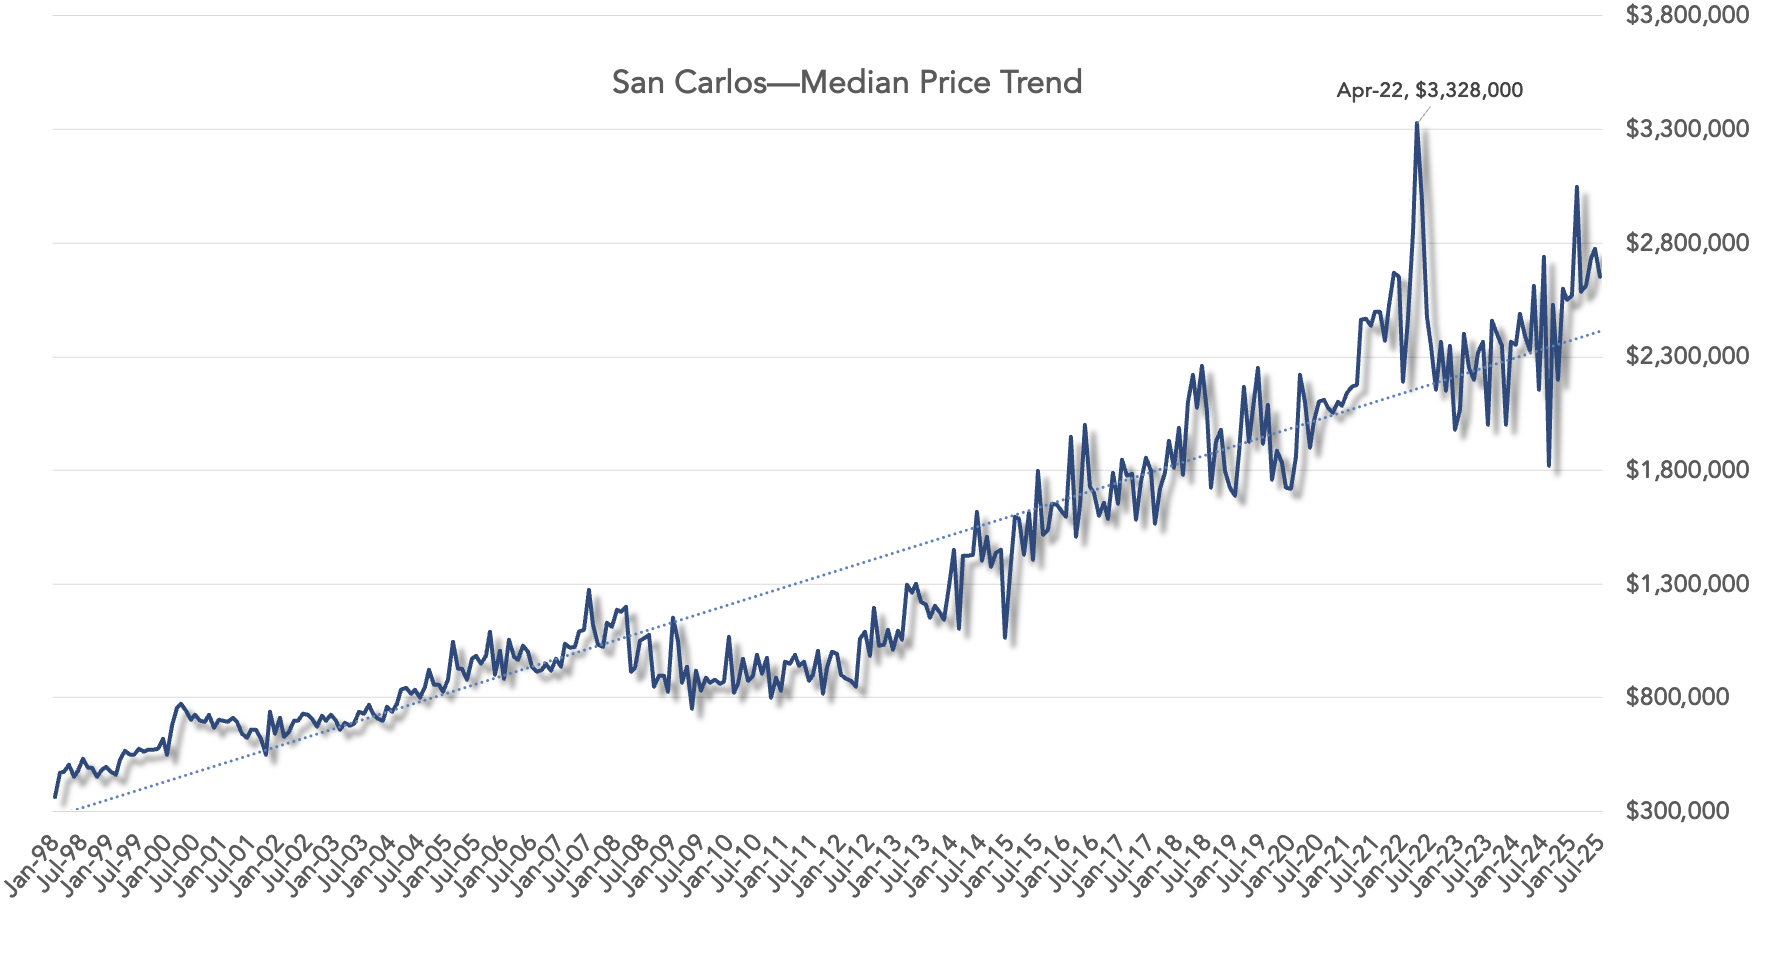
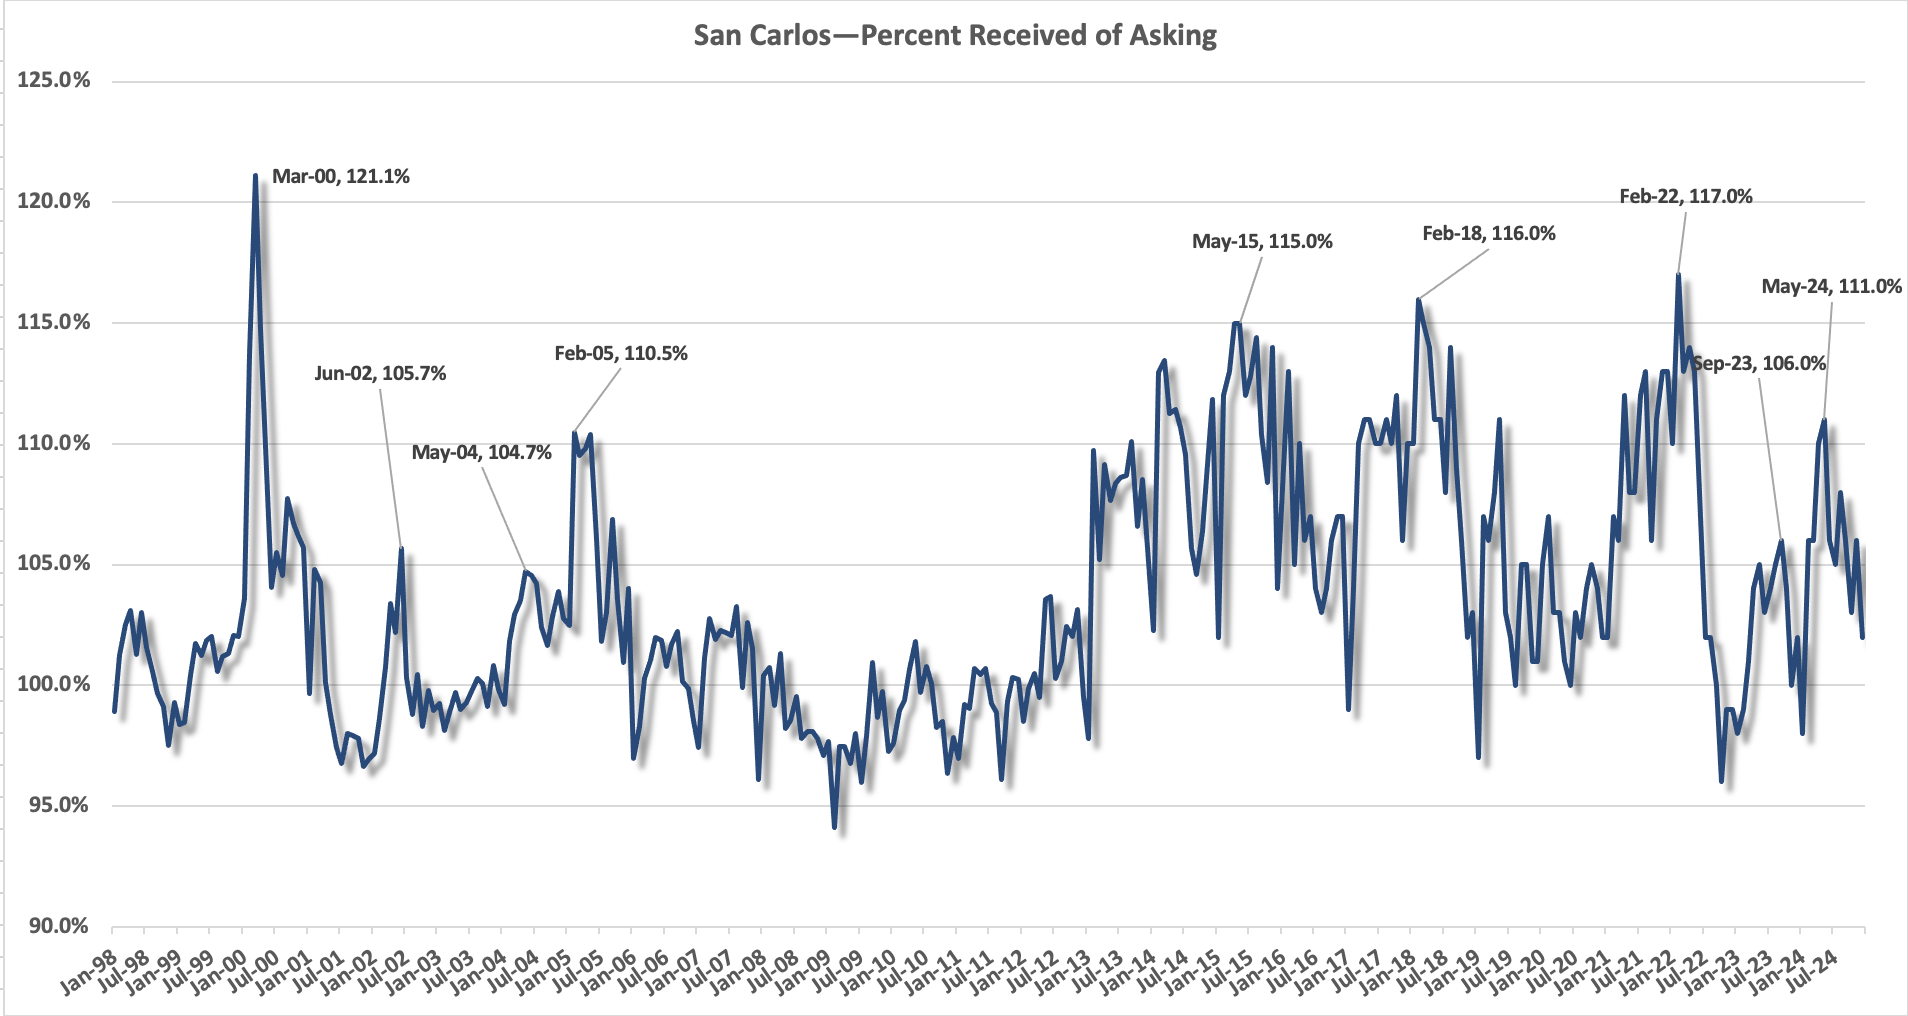
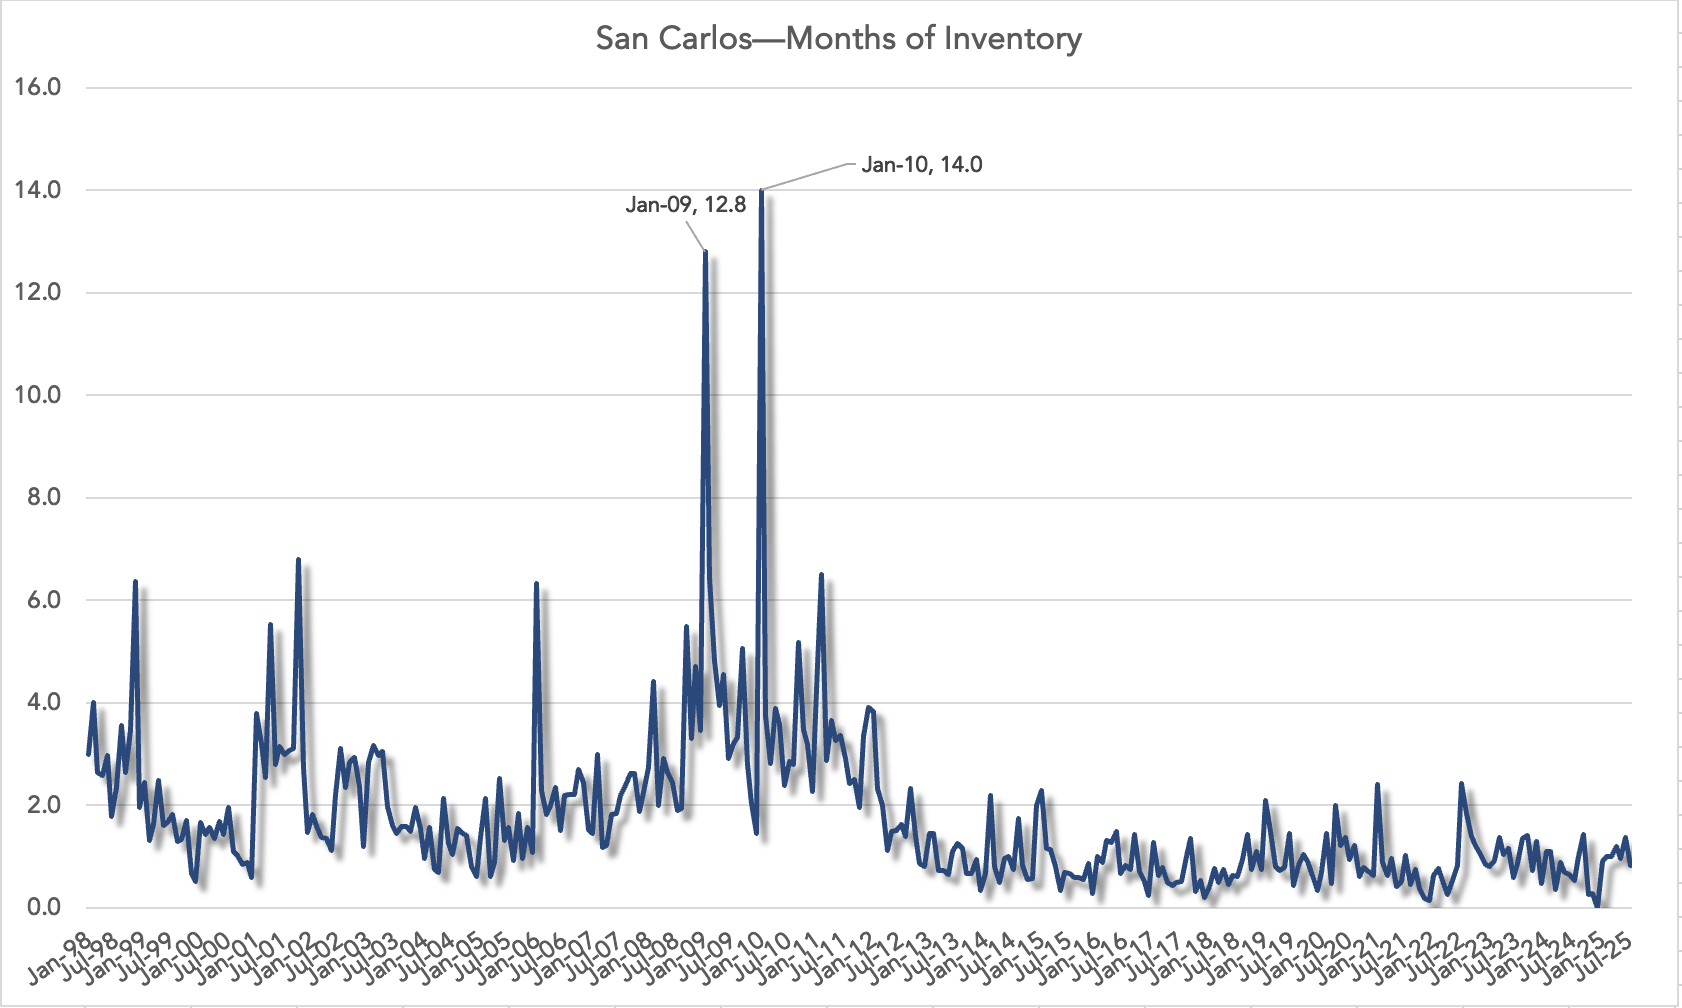
The San Francisco Peninsula market continues to outperform the country as a whole and even fairs better than San Francisco. Stand & Poor’s released their November data suggesting the largest decline "in history"—their history dates back only to 1991.

The decline, measured as a percentage, they estimate at -8.1% for the year in San Francisco (metropolitan area).

San Mateo County posted a -4.3% decline in appreciation in 2007 the first drop since 2001 when appreciation levels declined -8.4%. Notice in the graph below how in later years as prices rise even a small percentage in appreciation can mean a large increase in real dollars; conversely a small dip in the percent of appreciation can mean a lot in terms of real equity evaporating (if there is such as thing as real equity). Smc_appreciation_19982007_550_2 

How low it will go is anyone’s guess, but experts seem to think the turnaround could be in mid to late 2008.

  • Don’t Expect a Housing Turnaround Anytime Soon

The Mortgage Bankers Association Says Housing Problems Will Linger Until Mid-’08-ABC News, October 2007

  • Forecast 2008: Economy Slows, Housing Woes The decline in the turnover of existing homes is expected to bottom out by early 2008. But the related home construction activity that is so important to the economy is not expected to turn around until well into the year. As for the troubling housing price slide, that’s not expected to hit bottom until the end of 2008. By Phillip M. Perry (Dec/Jan 08)-Area Development

Adjusted Belmont Real Estate Median Price

Belmont

It’s interesting to note that in the last two years, for the first six months virtually the same number of homes sold—94 in 2006 and 92 in 2007.

After the July news of the mortgage industry financial issues, the overall uncertainty of the market, and undoubtedly with anticipation that homes values may drop, 2007 saw only 127 sales as compared to 167 in 2006 for the second half of the year.

Can one believe the reported median price for Belmont?

The MLS system reported the aggregate Belmont real estate median home price in 2006 to be $925,000. That rose to $945,000 in 2007 or a little over 4%. Further analysis reveals that the median size home which sold in 2007 was 95 square feet larger.

Understanding the median home sold in Belmont during 2007 sold for $548 per square foot and the median size home sold in 2007 was 95 square feet larger, this could account for as much as $52,000 in the reported median sale price for 2007. Which means the actual median price in Belmont was closer to $892,000 or a decrease of 3.4%.

But it matter less what happened for the entire year if the market incurred a sudden and radial change later in the year. In other words, even if the market went up 10% for the first six months if it dropped 15% in the second six months the current value as of December is more important.

Looking at Belmont’s median home price at the end of December in 2007 as compared to December of 2006, we see that in 2006 the median home price was only $850,000 and at the end of 2007 a whopping $1,025,000. Applying the same logic and adjusting for whether larger or smaller homes sold during the two periods, we see that in fact the median size home sold in 2007 was 370 square feet larger. Using our above price per square foot number of $548/sq. ft that eliminated $202,750 of apparent appreciation and means the true median price would be closer to $822,000 in 2007 as compared to $850,000 in 2006 or a 3.2% decrease year over year.

·         This report has been revised with the release of additional data. Sources used in data analysis included Multiple Listing Service searches and REILPro Statistics.