Skip to content
Our Listings
About Us
Services
Our Listing Services
Our Past Sales Area
Ambassador Services
Trust Estate Help
Buying a Home
First-Time Buyers
Our Coverage Area
Notary Services
Resources
Our Own Belmont Weather Station
How Much is My Home Worth?
Home Values & Sales Trends
Mortgage Calculator
Prop-19 Calculator (to Carry Tax Base)
Five Costly Mistakes Sellers Can Avoid
Keep Your Low Tax Base When you Buy a New Home
1031 Exchange
Deferred Sales Trust
Blog
Contact Us
Call Us: (650) 508-1441
Our Listings
About Us
Services
Our Listing Services
Our Past Sales Area
Ambassador Services
Trust Estate Help
Buying a Home
First-Time Buyers
Our Coverage Area
Notary Services
Resources
Our Own Belmont Weather Station
How Much is My Home Worth?
Home Values & Sales Trends
Mortgage Calculator
Prop-19 Calculator (to Carry Tax Base)
Five Costly Mistakes Sellers Can Avoid
Keep Your Low Tax Base When you Buy a New Home
1031 Exchange
Deferred Sales Trust
Blog
Contact Us
Call Us: (650) 508-1441
Featured Home
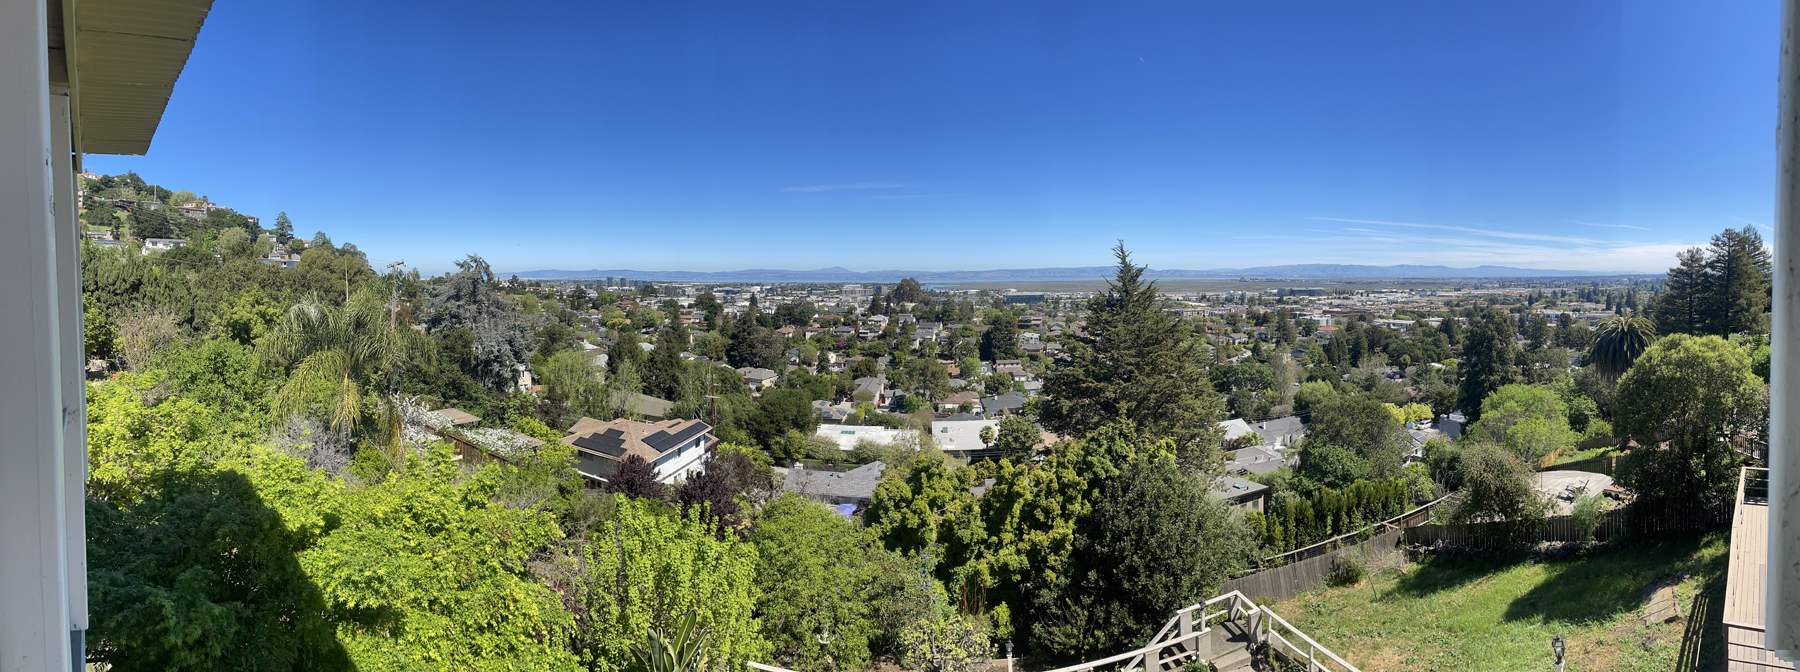
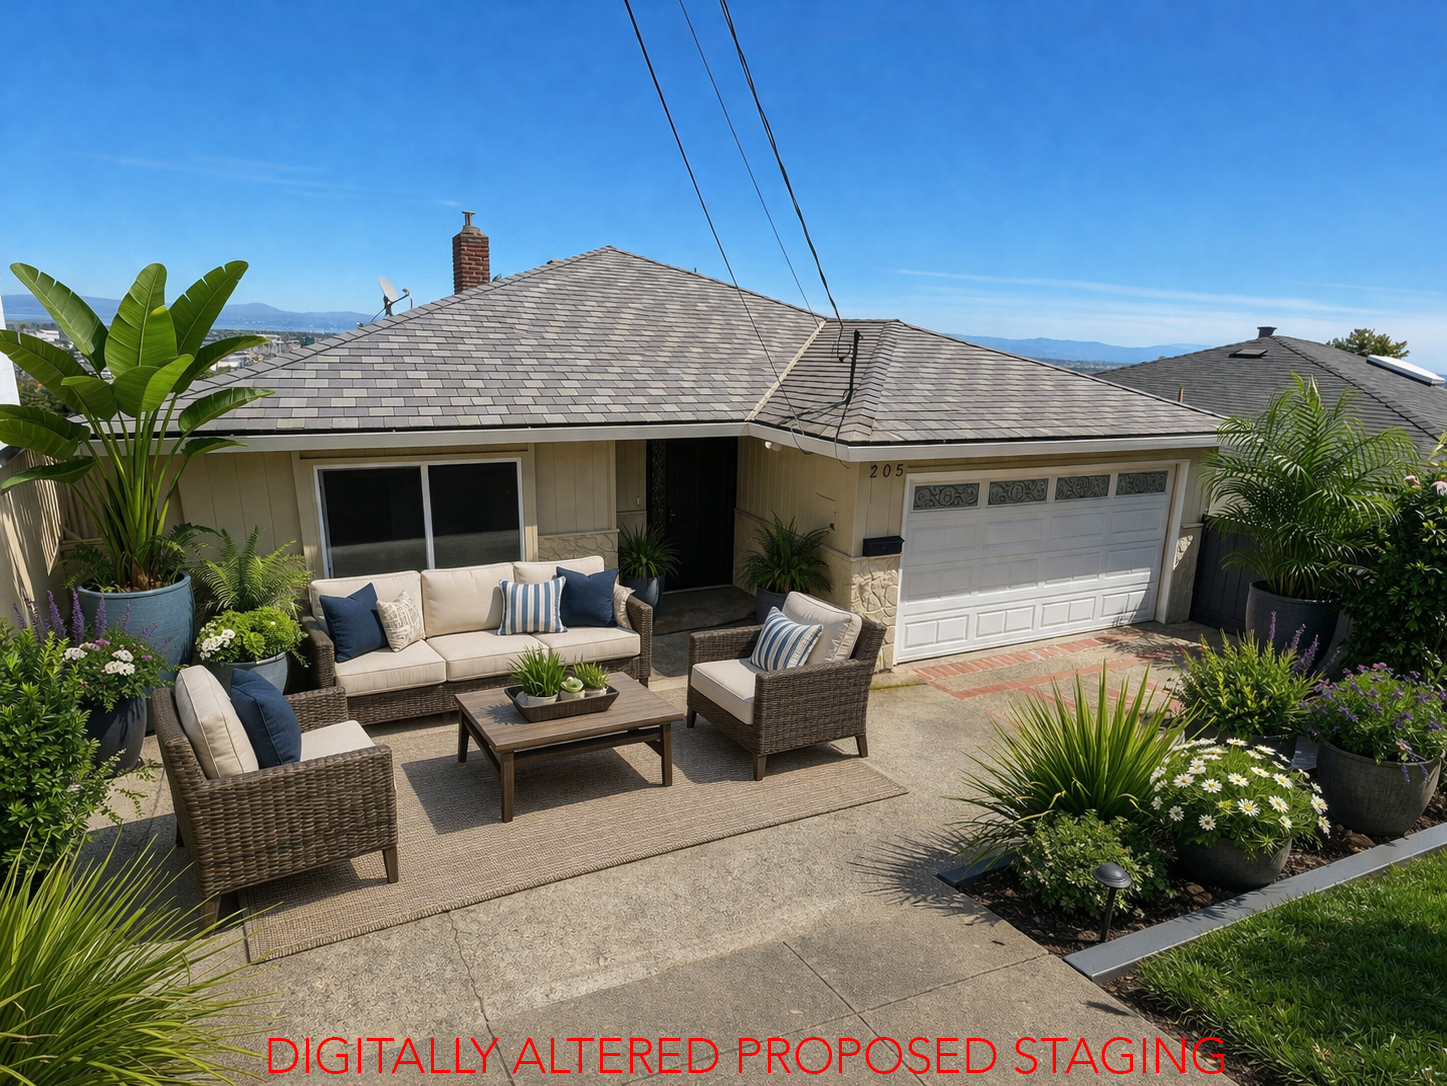
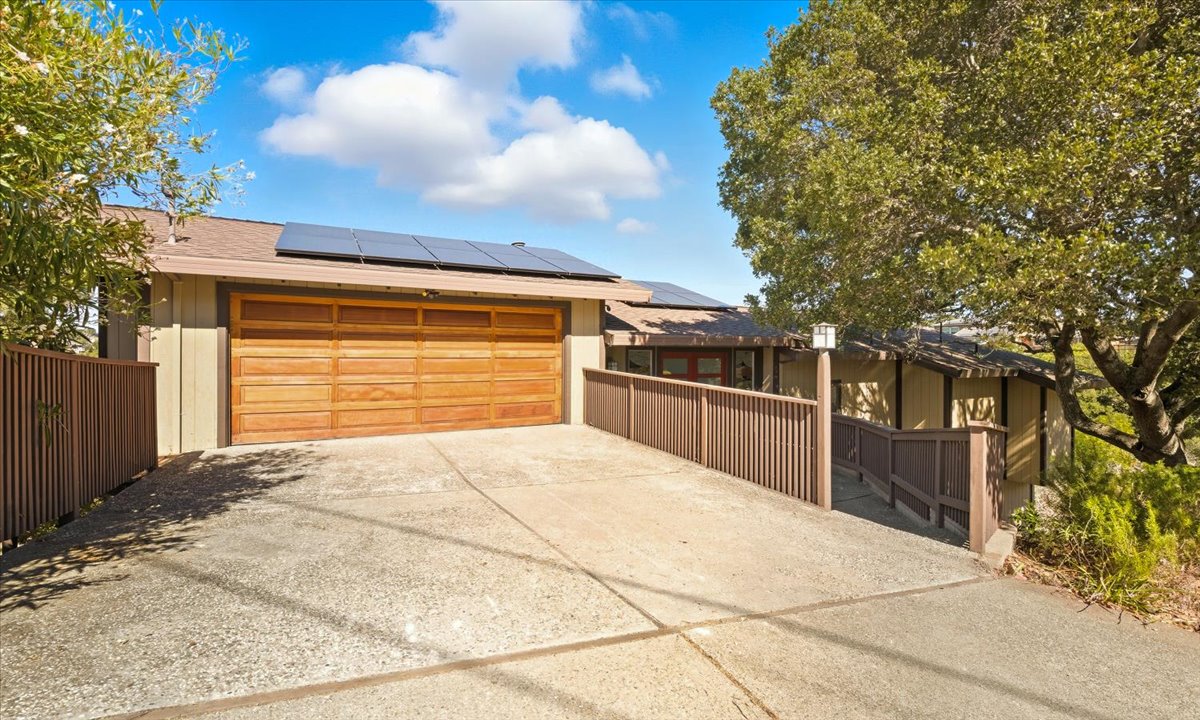
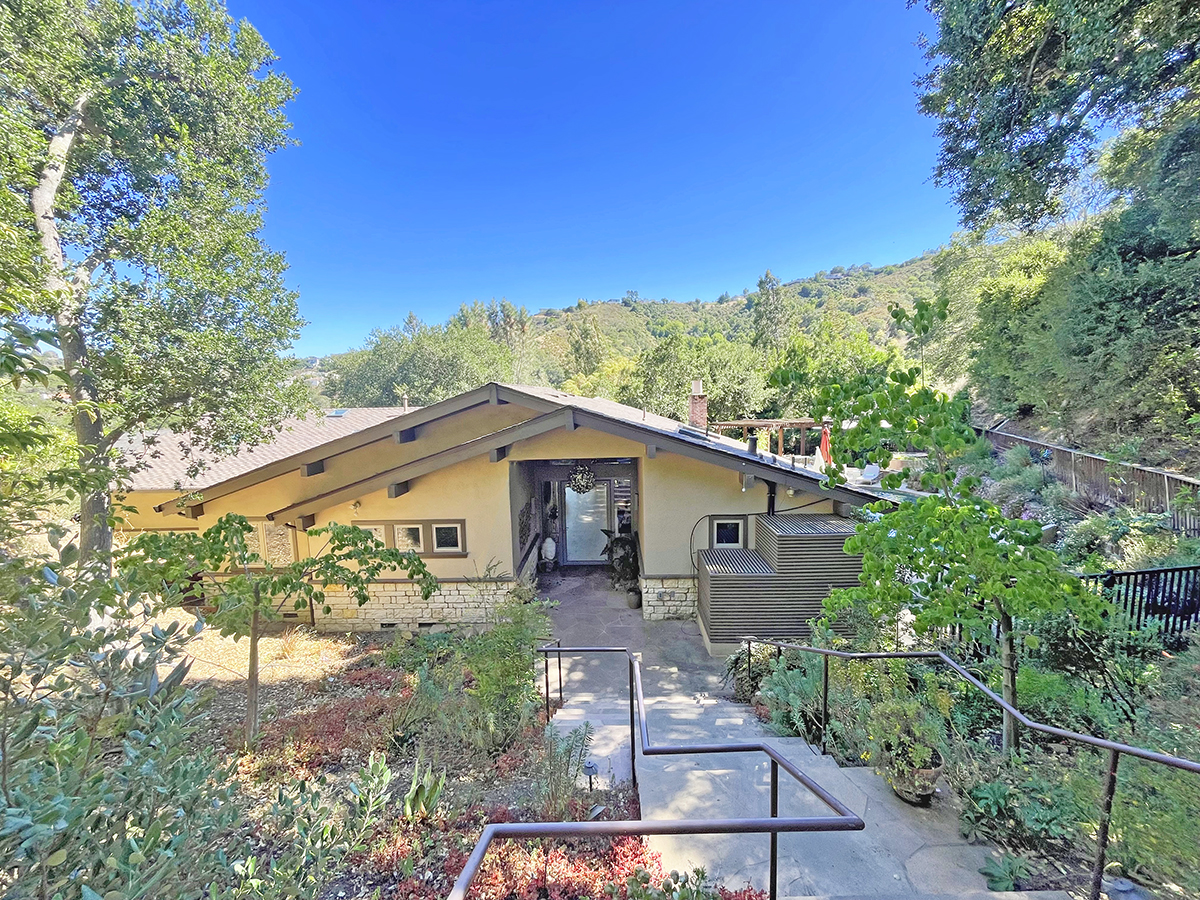
205 Hillcrest Road, San Carlos
View this Home
San Francisco Homes For Sale
Find Your Perfect Match
SOLD
205 HILLCREST ROAD, SAN CARLOS
$2,900,000
5 Beds
3 Baths
3,148 SQFT
UNAVAILABLE
1911 Easton Drive, Burlingame
$10,000 per month
3 Beds
2.5 Baths
3,200/6,375 SQFT
SOLD
3303 Haskins Drive, Belmont
$2,198,998 SOLD FOR $2,220,000
3 Beds
2.5 Baths
2,497 SQFT
SOLD
135 Lynton Avenue, San Carlos
$3,300,000-$300,000 Sold Over Asking
4 Beds
3 Baths
2,664/28,494 SQFT
SOLD
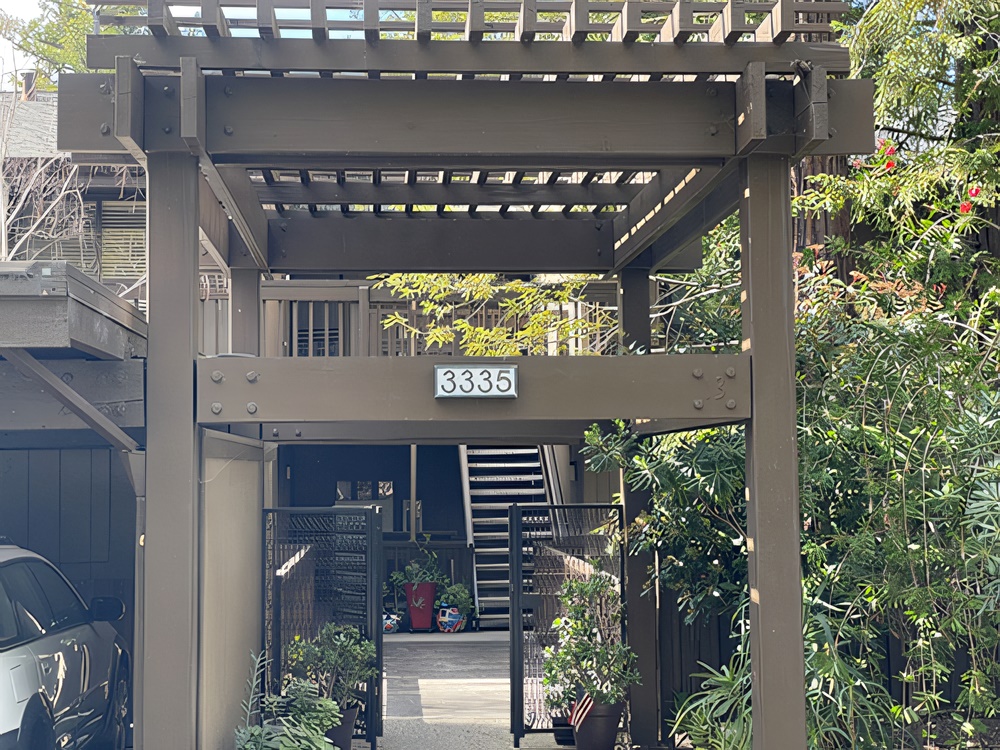
3335 Brittan Avenue, #6, San Carlos, CA 94070
$739,000
2 Beds
2 Baths
1040 SQFT
SOLD
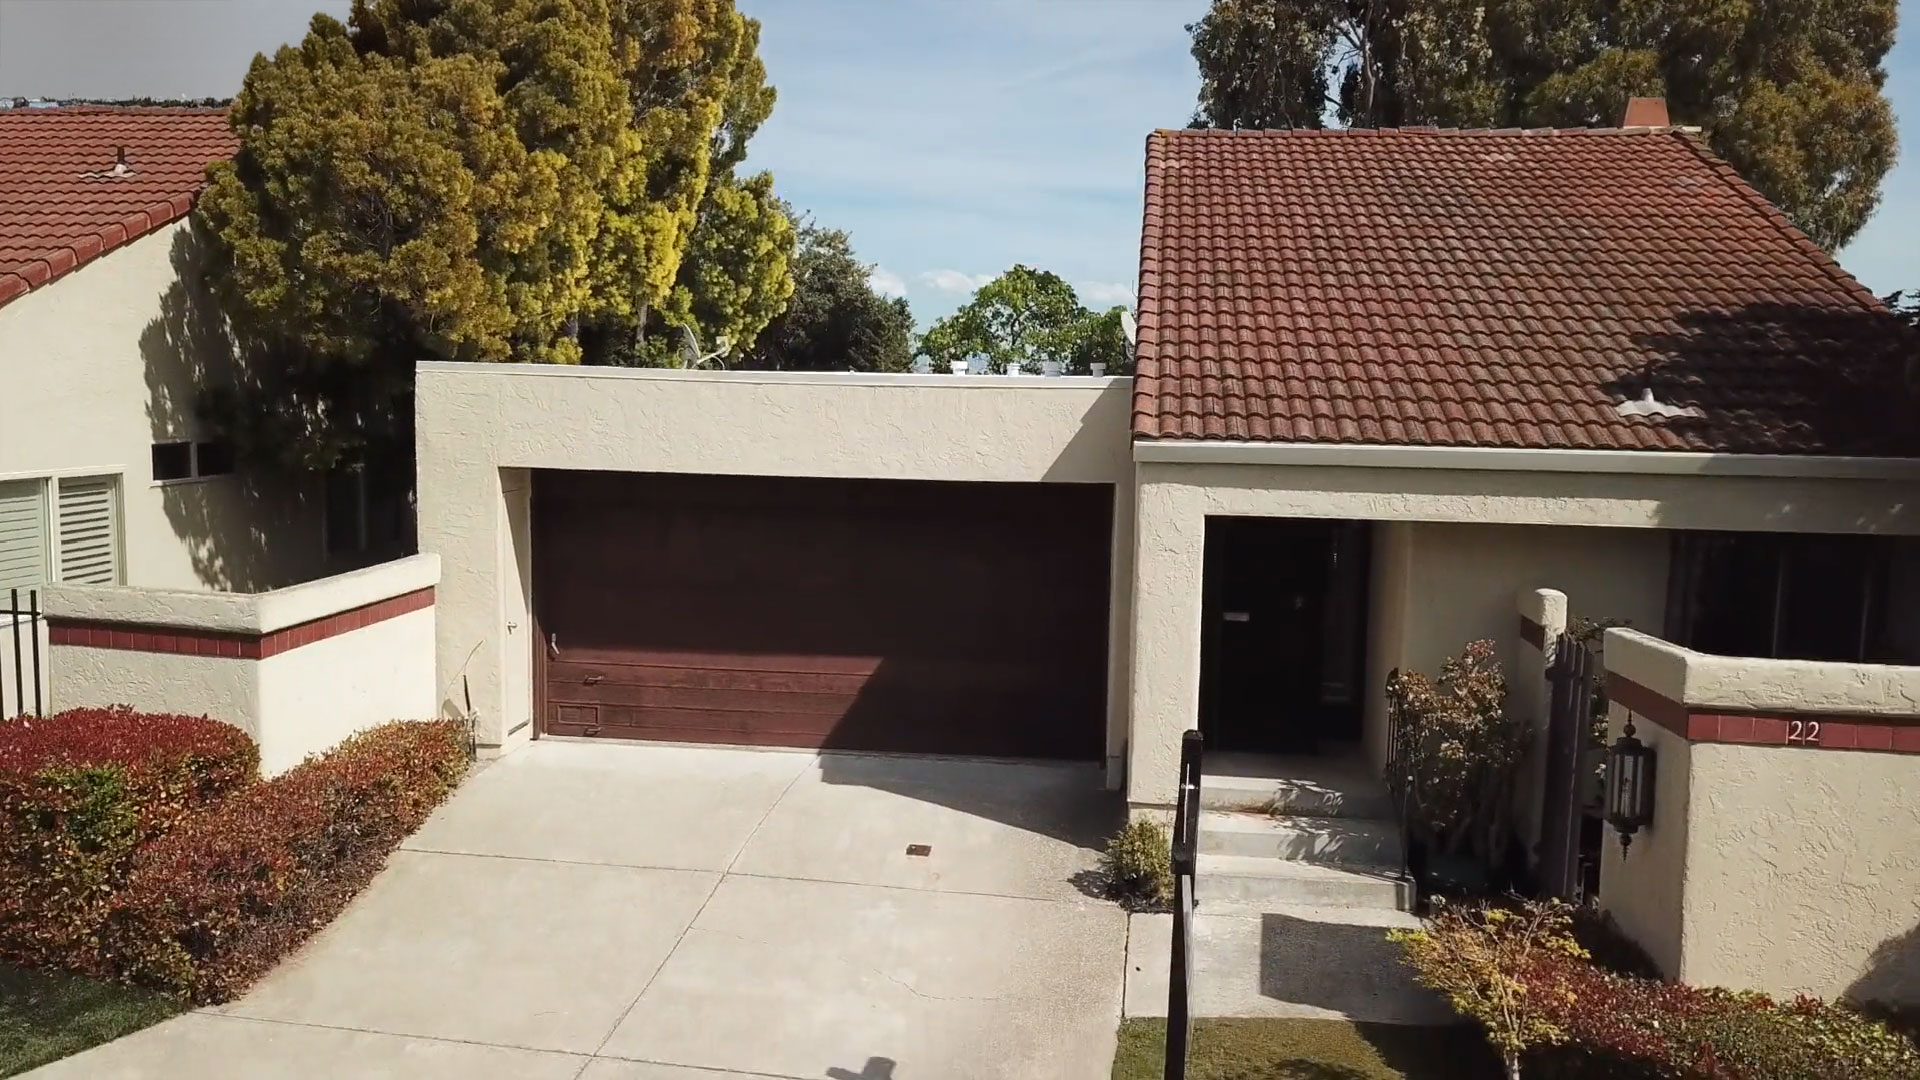
22 Cadiz Circle, Redwood Shores, CA 94080
$1,899,998
2 Beds
2 Baths
1320/4400 SQFT
SOLD
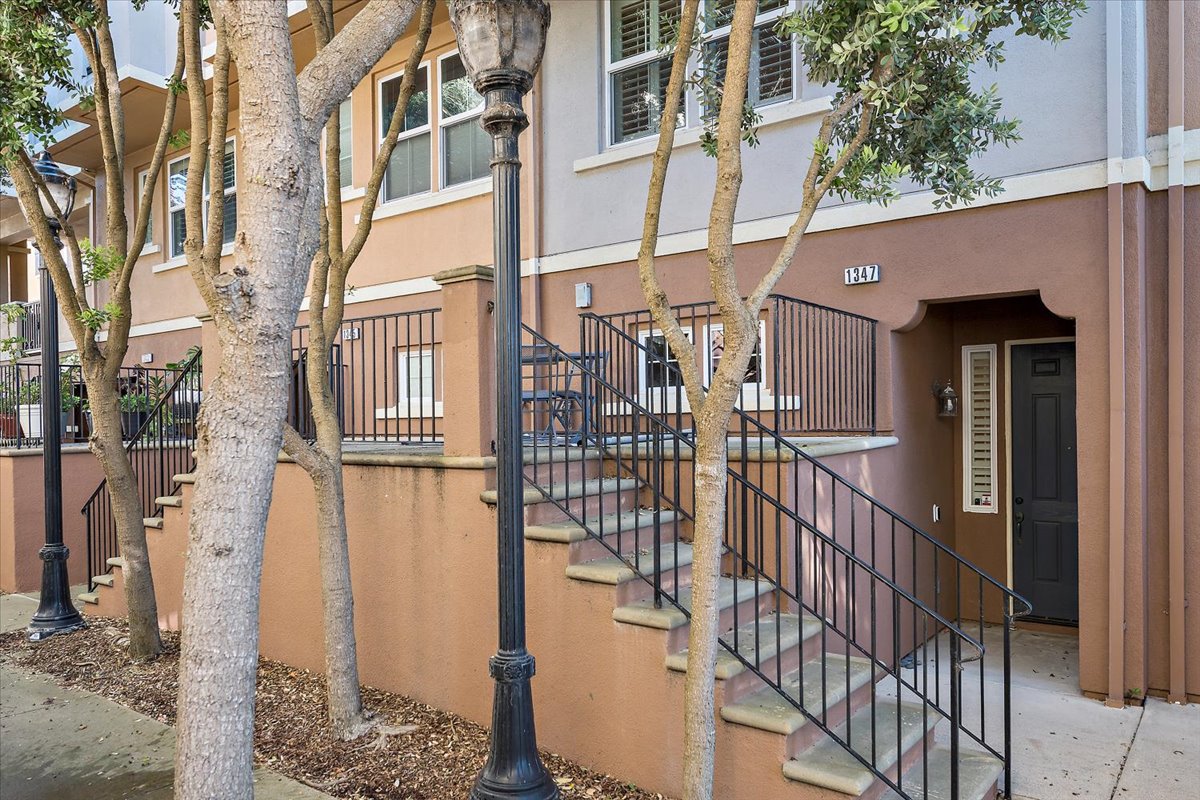
1374 Isabelle Circle, SSF
$949,998 SOLD FOR $1,000,000
3 Beds
2.5 Baths
1460 SQFT
SOLD
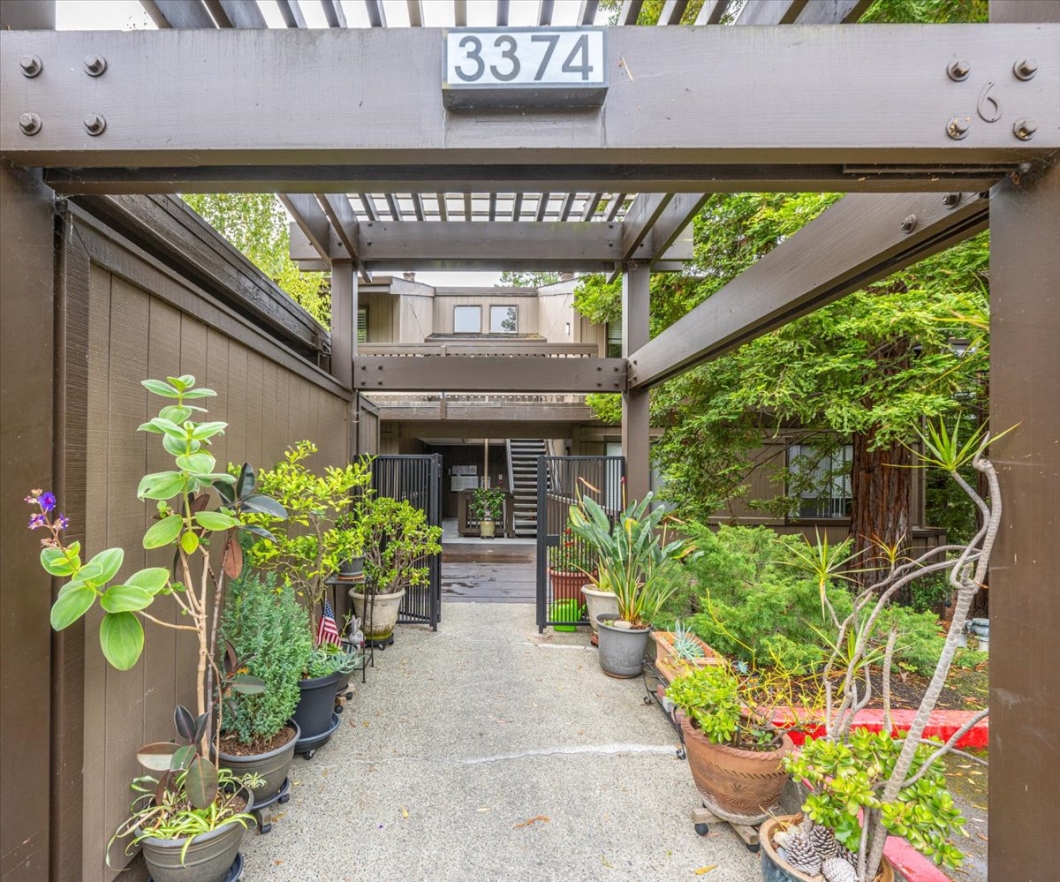
3374 Brittan Avenue #13, San Carlos
$1,049,998
3 Beds
2 Baths
1239 SQFT
SOLD
1160 SANTA LUCIA AVENUE, SAN BRUNO
$1,750,000
3 Beds
2.5 Baths
1780 SQFT
See More