Median Bay Area Home Price Near Worthless

What You Hear About Median Home Values May Be Completely Wrong

The Multiple Listing Service for the Bay Area peninsula has launched the December sales stats and there is some compelling evidence that Bay Area homes values dropped slightly over 2006.

The median home price is the midpoint at which half of the homes sold for more, and half sold for less. Of course if smaller or larger homes are selling then these numbers are easily skewed—especially with a small market sample.

SMC 2007
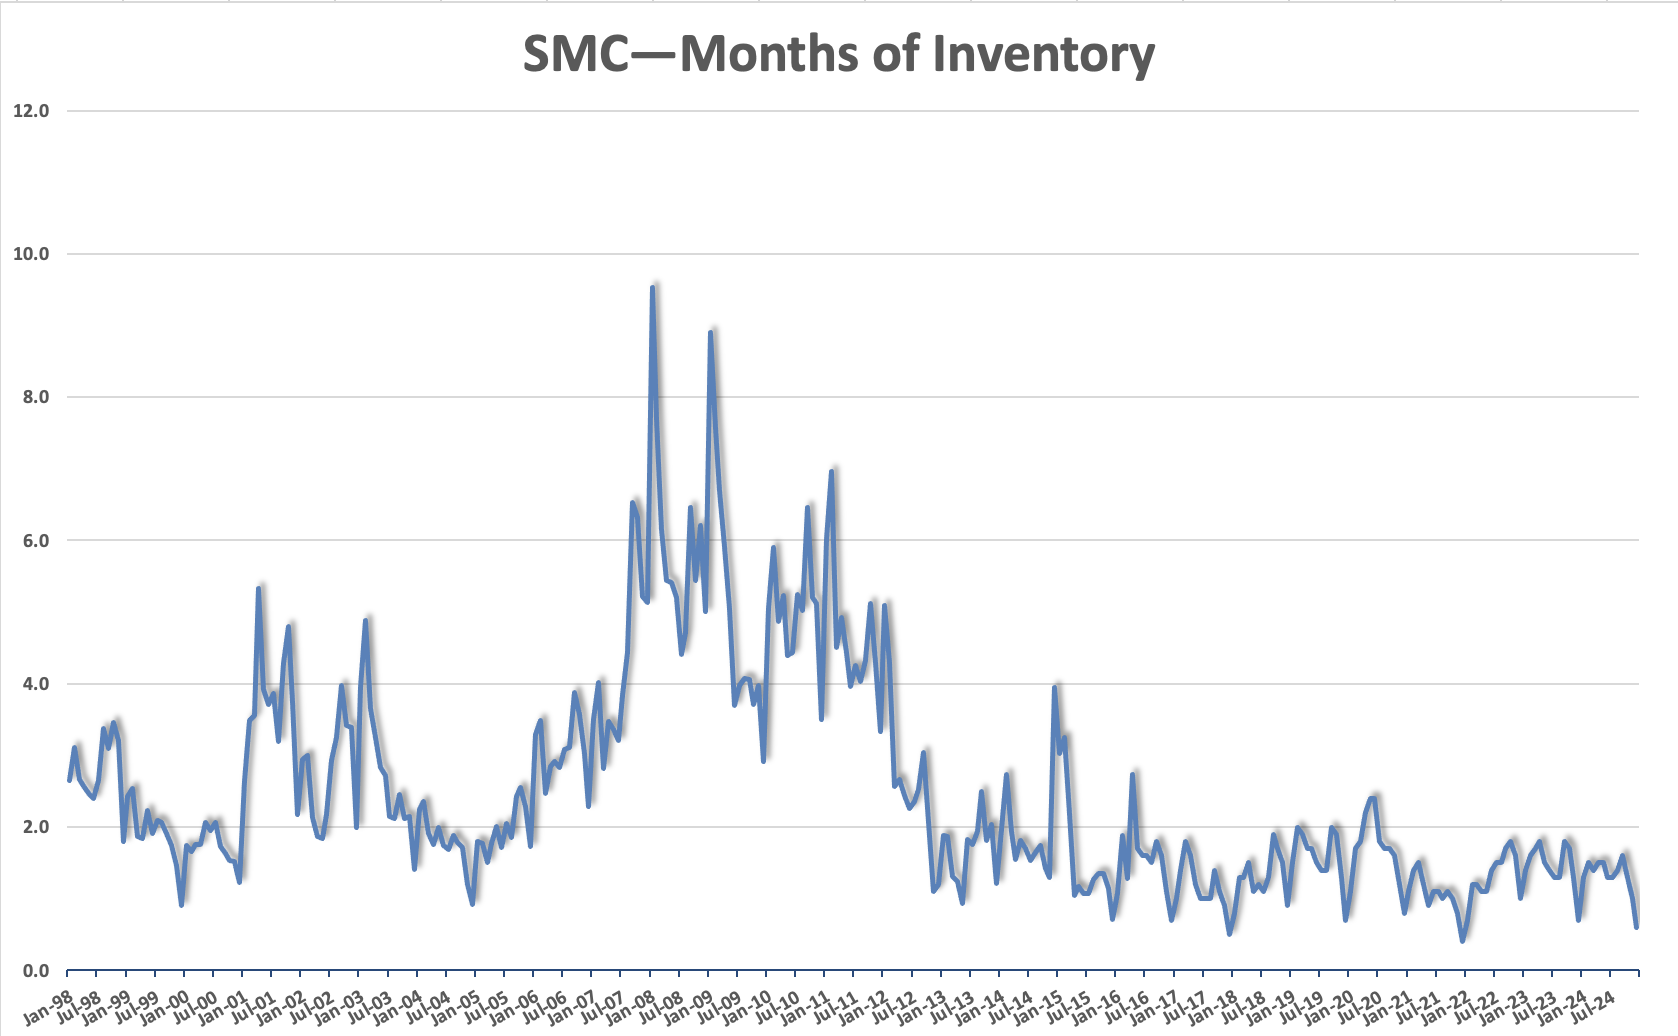
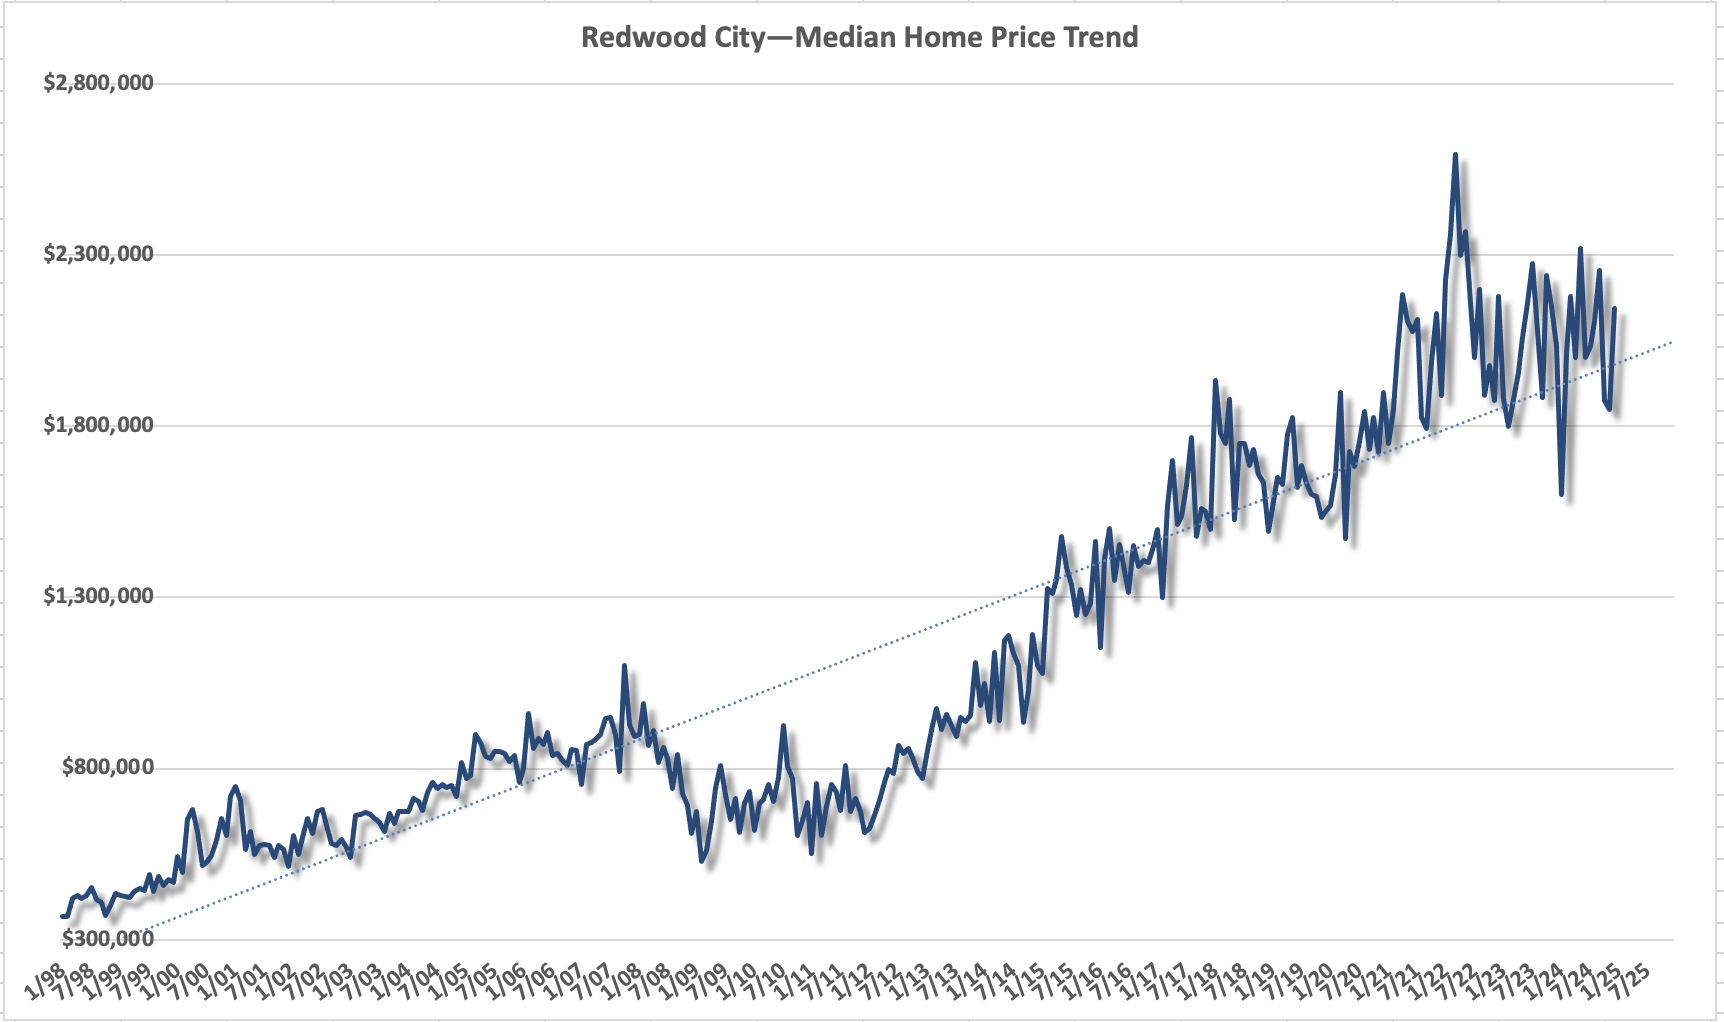
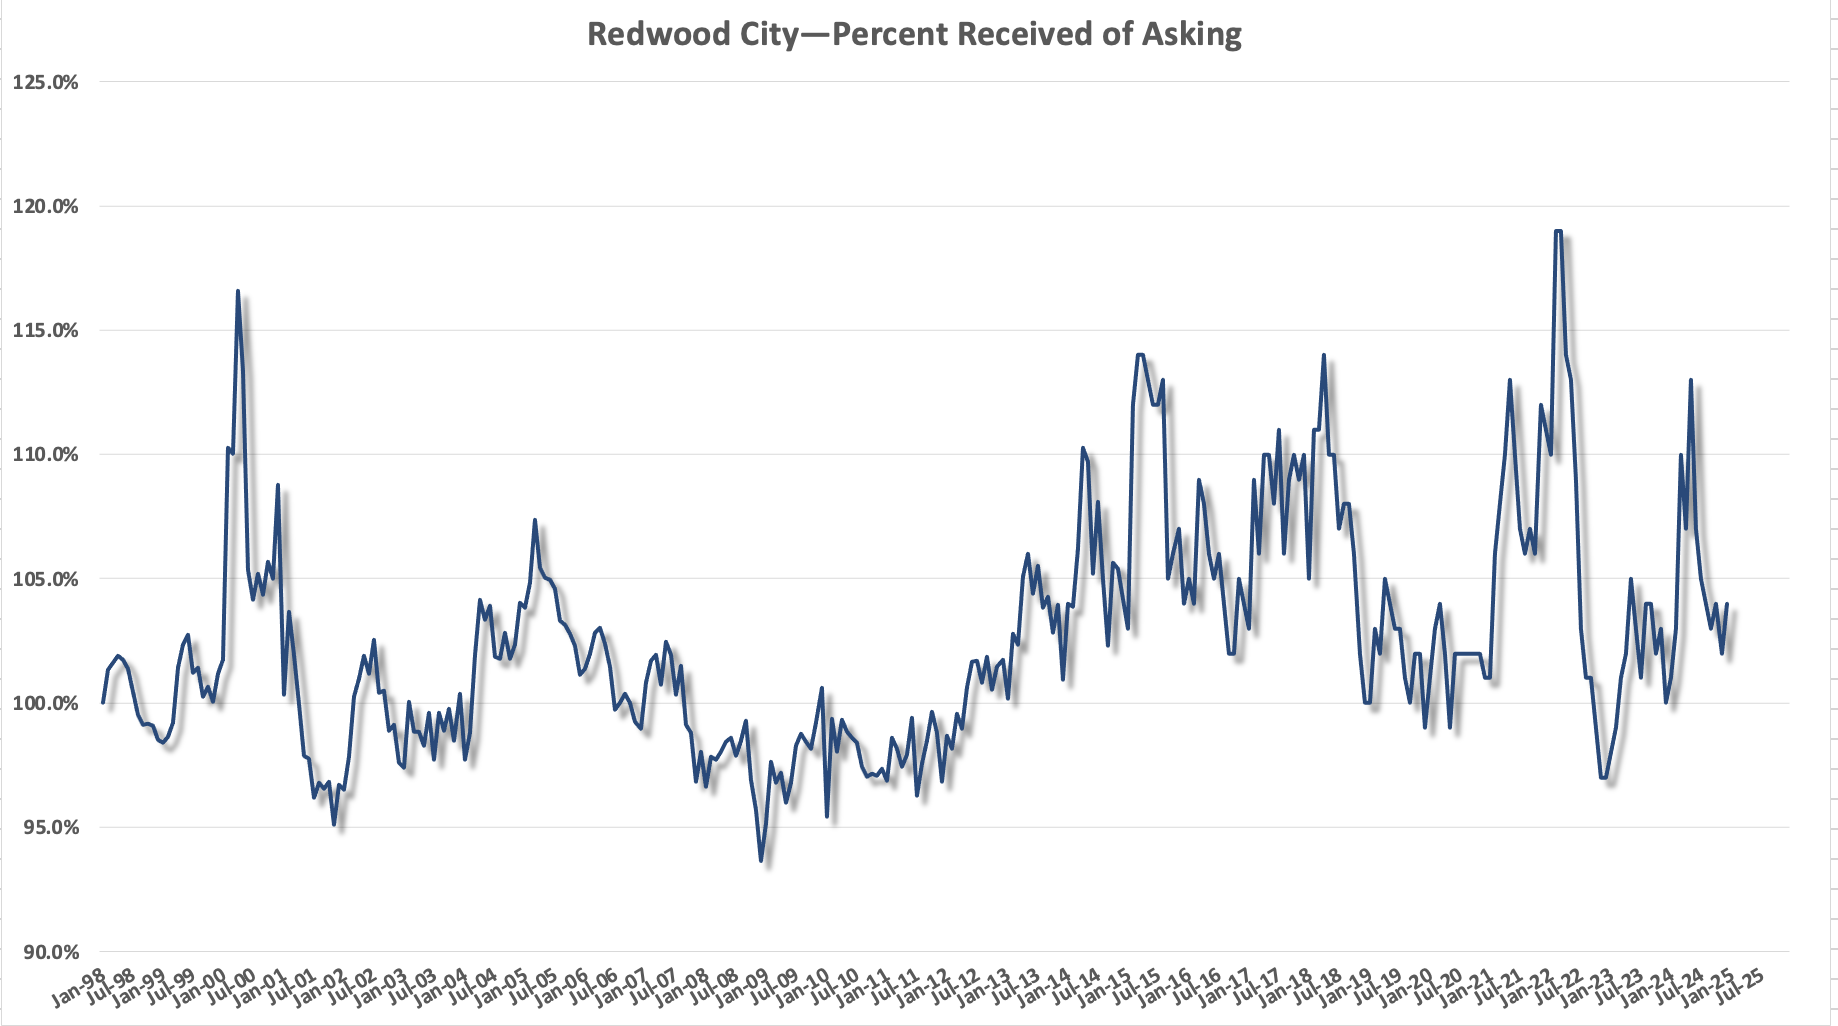
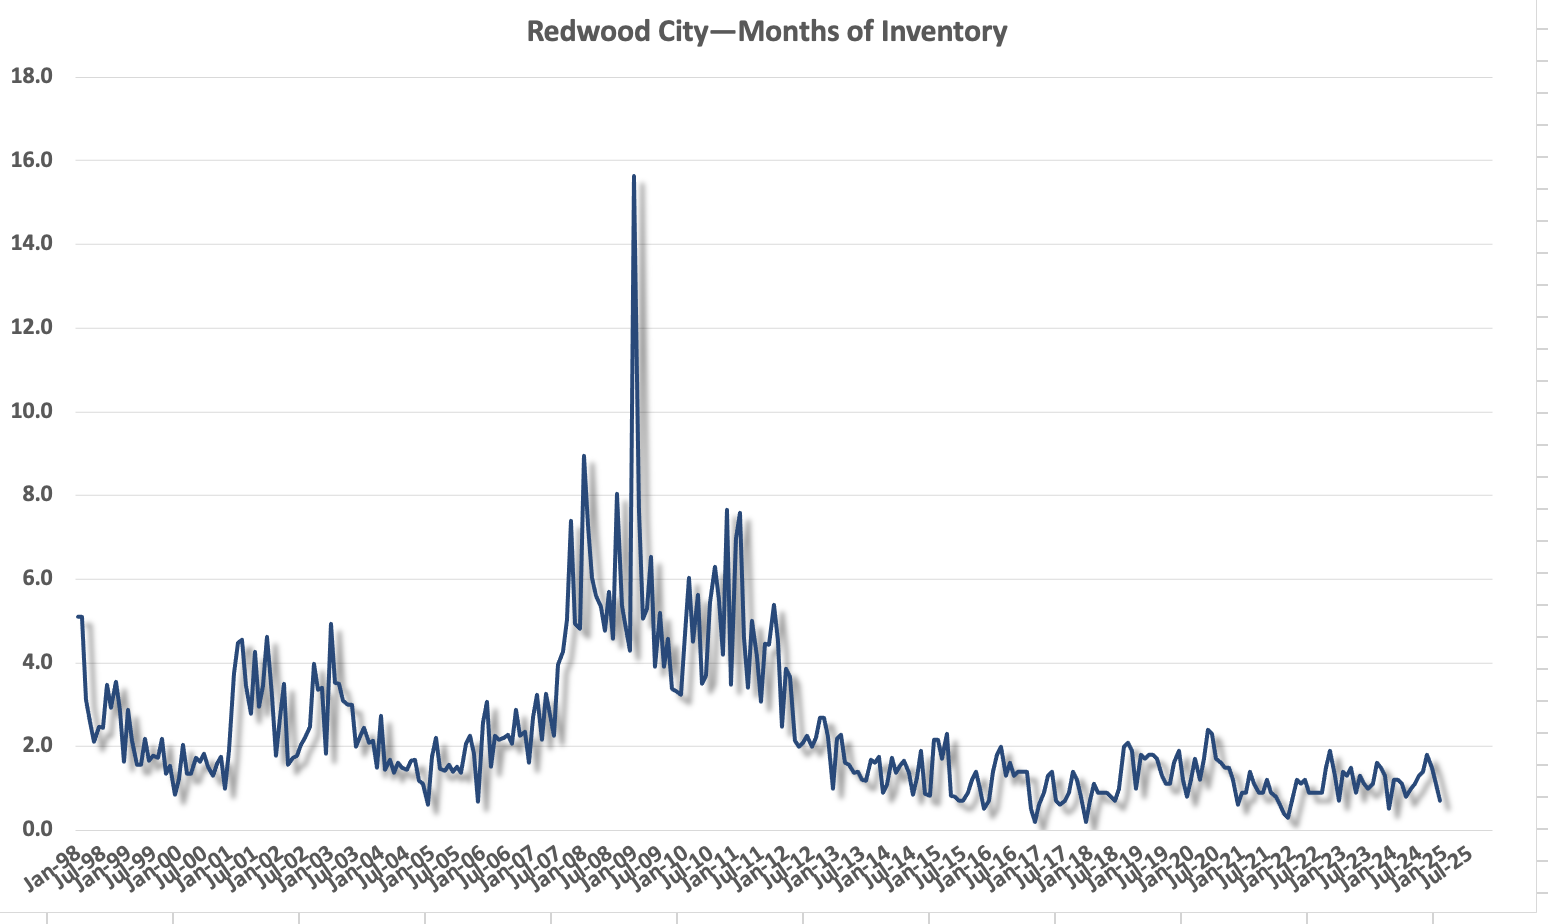
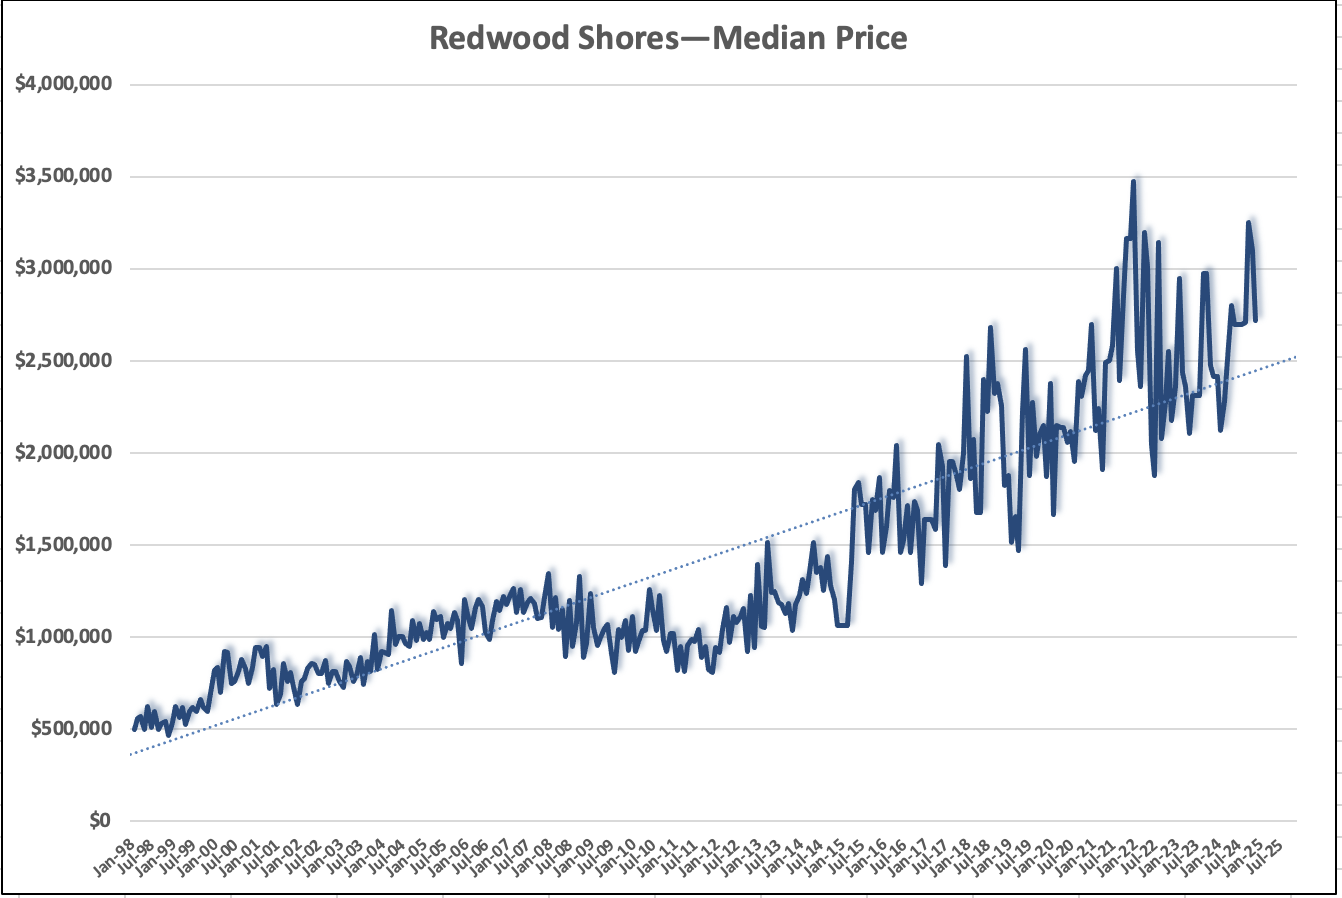
San Mateo County posted a reduction in the median home price to $885,000–a $40,000 (4.3%) decline over $925,000 in 2006.

This statistic could be wildly inaccurate though. Simply put, there’s no easy way to determine if the size homes which sold in a given year were larger or smaller than a previous year’s. Intuitively, given a large sample–totaling all sales for San Mateo County for example, one would expect the median size home to remain relatively constant and thus portray an accurate picture of the median home values. But unique market forces such as the ones we are currently experiencing are just the sort of thing that could skew those numbers. If for example, more first-time buyers purchased homes, the median size home included in the sales calculations would undoubtedly be smaller and thus skew the median price lower.

The Multiple Listing Service (or MLS system) which essentially retains all agent related transactions has its own inherent flaws. They derive the median home value by taking the median price for every home sold in a given year. If the housing market has a dramatic shift during the course of the year, it’s entirely possible that the median home price reported has nothing to do with the home values at the end of the year on December 31st.  In other words, it matters not whether home values climb for the first quarter of 2007, if in December they’ve dropped dramatically. The MLS median price is more a measurement of the average median value rather than the true median price at the end of the year.

Last year was a prime example of why reporting the median home price in this fashion is erroneous at best. In Belmont for example, there were 94 sales in the first six months of 2006 and 92 in 2007–virtually unchanged. However, the next six months after the July mortgage issues came to light, there were only 127 sales in 2007 compared to 167 in 2006. It’s a strong indication that the market changed in the second part of the year and why measuring the median values at the end of the year, rather than reporting the aggregate is a methodology more suited to a changing market.

In a small market sample such as the town we live in, Belmont, Ca, it’s even more imperative that one adjust for the median size of homes which sold. We incorporate this onto our calculations and low and behold an entirely different picture emerges.

Seller’s Can’t Afford to Overprice Their Home

Days on Market and Price Received Correlation

Though the nation’s mortgage industry is tumultuous at best, the peninsula market in the Bay Area is faring much better.

Last month 17 homes sold as compared to 14 in 2006 and off the high of 25 in 2005.

Of those 17 sales eight sold over the seller’s asking price, two sold at asking and seven homes sold under asking. Dom_received                                                                                    

The average time it took to sell a home was 39 days. Of the homes which sold over asking however, they took only 18 days to sell and on average sold for 3.61% over what the seller was asking. Seller’s which received their asking price took on average 40 days to sell, and homes which sold under the asking price averaged 56 days on the market and sold for 5.26% less than their original asking price.

Clearly, pricing a home correctly remains a crucial factor in getting the most for a home. These numbers illustrates a swing of almost 9% in what a seller received between a home priced to sell quickly and one which lingered on the market.

Alternative Real Estate Models


Drew & Christine Morgan,MorganHomes.com


Drew and Christine
Morgan
650.508.1441
"Helping People
Make Good Decisions"sm
MorganHomes.com
November’s Market Reports-Our custom
graphs


Find
Your Perfect Home
Search
for an Open House
Get
E-mail Home Alerts
What’s
Your Home Worth?
Moving
Soon?
How’s
Belmont’s Weather?
Want
to Compare Schools?
Belmont’s
Blog
Real
Estate Blog
About
Us


Our
Rebates
Our
Fees

Buyers:

Buying a home should be fun and exciting
yet the uncertainty of the process and the magnitude of the
investment can be daunting.

That’s where we help. Few if any agents
are as diligent in helping you understand the entire home
buying process. Finding a home you like is the easy part–getting
the home you want can be a challenge. From getting a loan,
to negotiations, inspections and escrow follow-through our
detailed team will assist you in understanding and even enjoying
the entire process.

Sellers:

Our reputation speaks for itself. In
16 years as a partnership we’ve sold nearly every home we’ve
listed for sale.*

In today’s market it’s all about getting
your house seen in both traditional print advertising and
on the Internet with virtual and video home tours. Our "Excite"
marketing plan creates a lasting first impression with high
impact roll out of your home’s advertising.


  • We’ve successfully negotiated hundreds
    of contracts

  • We’re never in a hurry unless you
    are

  • We explain the entire buying process
    and guide you through every aspect of your transaction

  • We tell you if we don’t like a
    home and if we’d buy it ourselves–we never want to resell
    a home we don’t like and we always want our clients to
    be happy

  • We know home values in our area
    and we can assist you in making a good decision

  • We offer a listing Guarantee

  • We have virtually a 100% client
    satisfaction

  • We typically sell our listings
    in a shorter time and for more money to the Seller

  • We specialize in peninsula properties

  • We are highly respected in the
    industry

  • We are detailed and thorough

  • We have superior print advertising
    and web presence


The Dual Income Trap

Elizabeth Warren, A Harvard Financial Law Professor writes in a very revealing article titled “The Middle Class on the Precipice” wherein she examines the dilemma now facing dual income families as spouses no longer have the added ability to enter the work force if even to temporarily buoy a family’s income. Scales_copy

Ms. Warren’s assertions can be seen as they apply to this year’s increase in foreclosures. In the 1970’s many households were single breadwinner families who purchased their home based upon a single income. This of course meant that if the sole money earner lost their job the other could fill the income void with temporary employment. Now that families are reliant on dual incomes, and qualify for their home loan based on two incomes, a loss of either income can be catastrophic if sufficient reserves do not exists.

Where will the next infusion of income growth come from? It seems highly unlikely that another source of income as significant as when dual incomes materialized will could arise in the future; leading one to speculate that the rapid increase in home values as experienced in the last 30 years is unlikely to continue at the same pace.

  • Housing is a necessity yet also very much a part of one’s financial portfolio—especially in the Bay Area. Own a home and let your equity develop.
  • Over the long term home ownership continues to be a sound investment. Buyers who are looking to purchase their first home should consider their job security.
  • There are better opportunities than in recent years but the days of 7-15% appreciation are over for now and flipping a home in a year almost impossible.
  • Qualifying on a dual income bases means you’re also reliant on two incomes and should also be considered.
  • Having to move due to job relocation or layoffs could put a financial hardship on a new homeowner if values have declined or not risen enough to cover selling costs.

Buyers—Should I Stay or Let it Go?

Much of the current real estate media attention has been focused on foreclosures and sub-prime lending practices. The media’s relentless impending doom stories have certainly rattled the nerves of the many would-be buyers. The question is should a buyer stay in the housing market hunt or let it go?

Ruggia0014c_2

Buyers tend to fall into at least one of three groups; buyers who believe the market will go down and are waiting on the sidelines, ones who can no longer qualify for a loan due to tighter lending guidelines, and buyers who see the new opportunities to own a home.

The Buyers who can no longer qualify for a home loan are probably better off not trying to get in over their head anyway. Stretching the ability to repay a loan is a recipe for disaster and many of the people who find themselves in foreclosure are probably wishing they had never bought in the first place.

The buyers who are aggressively looking for a home and seeking the market’s opportunities will most likely fare the best in years to come; buyers who wait until the media gives them the “all-clear” sign, will find they waited too long. Warren Buffet of Berkshire Hathaway, arguably the best investor of all time, states very succinctly in his business model that investors “…will understand that volatility provides investment opportunities and will use market drops to make good purchases." Mr. Buffet has also been quoted as saying “A good investor learns to insulate himself from market emotions and to make a distinction between market price and intrinsic value.”

Therein lays the dilemma. Is there any intrinsic value in Bay Area homes or are the prices overinflated?

Much has been made of possible housing bubble and many would claim it has burst while others feel the air is slowly being let out. Looking at historic trends in real estate we see that indeed the California and the Bay Area in particular outperform the country as a whole in housing appreciation.

Uscabay_area_median

This graph illustrates the median home price in the United States since 1968 as compared to California’s—the Bay Area was included as of 1982.

As one can see California has outpaced the country and the Bay Area outpaced California. It’s interesting to note that California and the Bay Area are more-or-less in step with each other while both clearly have grown faster than the country as a whole. But is this value real? Why does the Bay Area command these high home costs and can it continue? This is the very sort of data which leads many to conclude that California as a whole, and particularly the Bay Area, cannot sustain the price discrepancies with the rest of the country.

The Dual Income Infusion:

Twenty years ago, more and more California families became dual income families which increased their incomes by 75% and the ability to pay more for a home; and since a larger percentage of California families earned two incomes at higher pay, California began to outpace the rest of the county. Additionally, the advent of technology rich companies in the Silicon Valley infused a great deal of wealth to the Bay Area perhaps forever altering the discrepancy in home values. This added ability to spend more on housing is easily seen in the above chart discrepancy between the cost of a home in California vs. the country as a whole.

Where will the next infusion of income growth come from? It seems highly unlikely that another source of income, as significant as when dual incomes materialized, will develop–leading one to speculate that the rapid increase in home values experienced in the last 30 years is unlikely to continue at the same pace.

Buyers who are looking to home ownership should consider their job security. There are better opportunities than in recent years but the days of 7-15% appreciation are over and flipping a home in a year is currently all but impossible. Qualifying on a dual income bases means you are also reliant on two incomes and should also be considered. Having to move due to job relocation or layoffs could put a financial hardship on a new homeowner if values have declined or not increased enough to cover selling costs.

Locally, there has already been a slight decline in home values but we feel if economic conditions remain the same—or improve—this will be a short-lived adjustment. The market rebound will likely be slow to moderate with less aggressive growth and a healthier more sustainable market.

Housing is clearly a necessity. If you feel your job is secure and you have the wherewithal to afford housing now is an excellent time to entertain the possibility.

Read tomorrow’s article on The Dual Income Dilemma

Did the DOJ Get It Right?

One DOJ web page provides this insightful comment in a subtitle:

"B. The Internet’s Effect on the Real Estate Industry"

"With individuals assuming more of the responsibility to gather and assess information, less time and effort is required by real estate agents in assessing market conditions (for sellers) and in identifying and showing houses [(for buyers)]. The cost of an agent’s service, therefore, should go down reflecting this shift in burden."124

First this implies that everyone is assuming more responsibility gathering their own information. Some are and some are not.

The second part of the sentence: "…less time and effort is required by real estate agents in assessing market conditions (for sellers)…"

Nothing has changed in regard to the amount of time we spend to understand our local market. We still tour all the homes for sale whether we have a specific buyer for a property or not-we need to know the inventory. Agents cannot accurately asses the value of a home if they have not personally seen the comparables prior to the close of escrow. Isn’t that why appraisers call agents for the details on homes after they have closed escrow?

Third part:

"…less time and effort is required…in identifying and showing houses [(for buyers)".

Buyers may see a home on the internet and may exclude it from the search which in theory should cut down on the amount of time an agent will spend showing homes. This is an oversimplified version of how agents really find their buyer a suitable property. As stated before, we still see all of the homes for sale in order to be a specialist in our area. Buyers often want to see a home in person despite their initial on-line impression and often choose homes which they never would have entertained if it were not for their agent insisting on them taking a personal look. In fact the buyer’s access to instantaneous information has meant that agents must react even faster to the market and in many cases less efficiently. Prior to the email alerts systems which buyers now often subscribe to, agents previewed new listings for their clients on a specified "tour day" often in a caravan style with one or more agents riding in one car. With the Internet being updated every 15 minutes, agents are relegated to seeing all of the homes which meet their buyers needs every day in anticipation of an inquiry from their client.

Next Sentence:

"The cost of an agent’s service, therefore, should go down reflecting this shift in burden."

Burden, what burden are they referring to? A buyer’s voluntary perusal of available homes for sale which is provided solely because agents now create virtual tours, videos and upload all of the information is not a burden, it’s a marketing tool; but it doesn’t take the place of seeing a home first hand. Who pays for all of this new technology? What about the extra time and money spent in production?-perhaps that is why fees haven’t gone down as they anticipated.

On another page they continue by saying;"As a result, [of commissions staying at the same rate] the actual median commission paid by consumers rose sharply along with the run-up in home prices."

On this page the DOJ offers up a seemingly perplexing chart illustrating an apparent incongruity and implying that real estate compensation should be going down despite rising home prices due to healthy competition. What they apparently failed to take into consideration is that markets do not react perfectly and instantaneously to the adoption of new technologies simply because they exist. The technology learning curve which consumers and agents are enduring creates a lag in the effect competition will have on fees. Additionally, the influx of new agents, though dramatic, could not keep pace with the run-up in the median home prices; Licensees could not get licensed and effectively start practicing real estate at the same pace of home appreciation to provide ample competition and offset the higher commissions (in real dollars not as a percentage).

Don’t get me wrong, we’re all for competitive practices, but if the Department of Justice is going to be analyzing this data they need some better advisors helping them understand the industry.

When’s The Best Time to Sell a Home? (Part one of a five part series)

Drew & Christine Morgan-Belmont Real Estate

"Helping People Make Good Decisions"sm

Introduction:

Welcome to the introduction of our five part series on when is the best time to sell a home. We’ll examine issues that affect home values and selling opportunties on a macro level, and then provide detailed information for our market sector. We hope you enjoy the series.

When’s The Best Time to Sell a Home? That simple question is one of the most frequently asked when we meet a seller. Unfortunately, the answer is not as easy.

There are many factors which may influence your local market and having the data certainly helps one examine when may be the best time to sell a home

Everyone knows real estate highs and lows-like in business-are cyclical. The recent 10 year run up in home values nationwide appears at its end (for now); though some parts of the country remain more effected than others.

In this five part series we’ll examine some of the indicators you can watch when trying to determine where your local market may be headed.

On a macro scale, the overall housing outlook can be affected by a multitude of factors and indicators can be seen along the way. In this five part series we’ll look at the following:

And on a more local level:

We are entering uncharted waters with the recent defaults of high risk loans, Wall Street’s pull back on mortgage investments and the demise of several prominent lending institutions. Money will be harder to get and more expensive. Those who were counting on refinancing their variable rate mortgage at the end of its fixed period, have no equity left and cannot afford their current payment will be forced back into the rental market. This will cause home inventory levels to increase and home values to decrease. Fewer buyers with more choices will equate to lower selling prices. To the extent that jobs remain steady (or increase) interest rates level off, fallout from the mortgage industry dust settles and buyers perceive new opportunities to purchase their first home, this storm too shall pass. How much and how quickly it will be mitigated by these factors is anyone’s guess.

Thanks for reading this introduction and check back for the continuation of this five part series.

You can see detailed San Mateo County market reports on our web page at MorganHomes.com

Drew & Christine Morgan-Belmont Real Estate

"Helping People Make Good Decisions"sm

What’s in a Status Symbol?

Ever wondered why you might see a home with sign in the yard and not be able to find it on the internet? Read on. Status symbols and what they really mean.

This can be a bit confusing if you aren’t part of the local multiple listing service so allow me to clarify these terms.

When we list a home for sale is becomes "active" in the MLS system. That’s the first status and it’s referred to as status "1", aptly named. This is when people who have subscribed to automated email alerts generally receive an email announcement that the home has been listed for sale-often times indicated with an [A].

If you see a "Pending Release" or "Pending Sale Release" it typically means an offer was accepted which contains a contingency (usually on the sale of the buyer’s home). This means that the seller has accepted the offer but can release the buyer from the contract if they get another (usually better) offer. This is typically reported as "SALE PENDING RELEASE" or status "2" in the MLS system-also denoted as [PR].

A release clause may be employed in any contract but it’s typically relegated to sales wherein the buyer must sell a home to complete the transaction. Not wanting to be tied up for a protracted period of time, the seller may add a "release clause" to have an option to cancel the contract. Release clauses are typically upon 72 hour notice but they could be whatever the buyer and seller agree upon; and they are typically reserved for when the buyer has a home to sell but again they could be used in any scenario where the buyer and seller agree.

The way a release works is simple. Say you’ve accepted an offer on the home you are selling for $1,000,000, but the buyer must first sell their home to complete the transaction. The seller might agree to your offer but add a release clause stating that upon notification (some point in the escrow period) you have 72 hours to remove the contingency or the seller can then elect to cancel your contract and accept another offer or move a back-up offer into first position-it’s sort of a warning shot across the buyer’s bow if you will. Now let’s say another buyer brings you an offer for $20,000 more after you’re in contract with buyer #1. The first buyer must after written notice either remove their contingency within 72 hours or risk losing the property. So why would a buyer agree to this? Usually because they have no choice. Most sellers insist on this, but secondly the buyer may have sufficient funds in which to close the transaction either in stock or equity but for whatever reason would rather sell their home first. Faced with the 72 release notice, the buyer can then elect to let the home go to another buyer or cash in stocks or their equity and remove the contingency. This way the buyer is not forced into liquidating stocks or paying interest on an equity line of credit until and if necessary.

Status 3 is Pending Sale continue to show. [PS]

This simply means that the seller wants to continue and have their home shown to prospective buyers, and agents. Typically this means there are contingencies in the accepted offer and until they are removed it usually stays in this pending continue to show state. This status is typically reserved during financing and inspection contingencies.

Status 4 is Pending DO NOT SHOW. [PN]

This typically is used when all contingencies have been removed by the buyer but it too can be employed earlier at the seller’s election. This is usually where a property will drop off of the radar by most internet search engines. That’s why you may see a home with a sign in the yard but not be able to find it any longer in the MLS system via the internet.

Status 5 is SOLD and used for when the home has transferred title to the new owners.[S]

Disclaimer: This information is for entertainment purposes only and includes no legal, accounting or real estate advice nor is this response in tended to be specific to your situation-consult a specialist for your specific situation.

Full Service vs. Limited Service or Virtual Agents—Is There Room for Everyone?

The short answer is of course yes. Different sellers have different needs and abilities and some may choose a full service model and others limited or no service at all-the choices have been there all along. Yet the arrival of virtual Internet brokers has spawned a new ideology of it’s either "us or them".

 The very survival of limited service or virtual Internet brokers relies on two things: The first is they are able to convince everyone that paying a 6% compensation is the only alternative to their "discount" model, and the second is that they must convince their prospects that the minimum service they provide is all that is needed to sell a home; and everything else which a full service agent does is a waste of their time and your money.

These assertions that they need you to believe are false. Frankly; it’s a bit surprising that the Department of Justice has not sought sanctions against this type of misinformation when the average real estate commission across the country closer to 5.1%. One of the most misleading impressions that limited or virtual companies imply is that full service agents and discount agents are mutually exclusive-they aren’t.

The second scenario is one which needs more discussion. The premise that a limited service or on-line virtual broker can sell your home is not as questionable as the issue of for how much? Any homeowner wishing to "sell" their home could market it considerably below market value and so long as they were able to communicate to the public that their home was for sale, they would most certainly be able to sell it. How much money they may leave on the bargaining table and the repercussions during and after the close of escrow may linger long after the check has cashed.

Hiring a real estate agent is akin to a homeowner deciding how to do a remodel. As a homeowner you have the right to be your own general contractor; what you have to ask yourself is a) do you want to take that on (do you have the time and ability) and b) are you qualified-as in knowledgeable. You also have the right to hire the cheapest general contractor you can find. But why complain about more expensive ones when cheaper ones are available. Hire who you wantthere are options.

See Part Two–Examining the Real Estate Models

Drew & Christine Morgan Morganhomes.com

Visit our Blog at BeautifulMountainBlog.org

Disclaimer: This information is for entertainment purposes only and includes no legal, accounting or real estate advice nor is this response in tended to be specific to your situation-consult a specialist for your specific situation.

Sub-Prime Lending Mess

What is a sub-prime loan and why are the folks in trouble? Simply put a sub-prime loan was a loan which offered people to purchase homes for which they were not qualified to purchase. For example, a lender might have offered a new buyer the opportunity to own their own home with no money down. Many of these loans offered various payment options. The traditional payment of principle and Interest fully amortized over 15 or more commonly 30 year periods. At the end of 30 years, you owned the home. One variation was to offer an interest only payment. In this scenario the buyer would pay the interest portion of the monthly payment only—deferring the principle payment until the time of sale. In this scenario, a borrower never actually paid off the principle, but it helped many would-be homeowners become a "homeowner".

Here are three payment options many of these loans provided: principle and interest, interest only or negative amortization. A negatively amortized loan payment is less than a fully amortized payment or an interest only payment since the borrower is only paying a portion of the full inertest due and nothing towards the principle. In the following example we see what these three payment options would do to a homeowner’s payment.

Loan amount            $300,000    Rate 6.5%

Principle & Interest payment    $1,896.20

Interest only            $1,625.00

Negatively Amortized        $1,125.00 (4.5%)

As is evident, it was very tempting to opt for the negatively amortized loan since it dropped the out of pocket monthly mortgage payment $771.00. Of course this meant that the loan actually grew rather than diminished which is why it is called negatively amortized as opposed to fully amortized. The $500.00 difference between the interest only payment at 6.4% of $1,625.00 and the lower effective payment at 4.5% of $1,125.00 was added to the loan balance each month—though the payment stayed the same.

Why would anyone take out a negatively amortized loan? Simple; it made housing more affordable or in some cases more housing affordable. For investors, it freed up much needed monthly cash flow (money used to purchase other investment properties) and made owning investment properties where otherwise rents would not cover their expenses, affordable.

Why in many cases it didn’t work.

Banks made a huge error by aggressively qualifying the borrower at the artificially lower negatively amortized rate. In the above example, a borrower would only have to quality for the 4.5% payment instead of the 6.5% actually charged. Many of these loans were only capped at these lower rates for five years. When these began adjusting to higher interest rates—the actual market rate— homeowners and investors alike found themselves in trouble.

For investors, owning a property where the rents no longer cover their expenses, no longer made sense and they began selling their properties as fast as possible. Since many of these investors took out the similar loans, many began adjusting at about the same time—flooding the market which speculative property sales.

Many homeowners faced with the same interest rate adjustment dilemma found they could no longer afford the monthly payment. In cases where they had put no money down, and opted for the negative payment, they soon found themselves with no equity either—further tempting them into loan default status. Since they had nothing to lose, many simply walked away from their homes.

As one can imagine, with this many homes coming available at the same time, compounded by the overabundance of new construction, inventories rose at a time when buyers wanted out of the market. Fewer buyers, and more inventory equals lower prices, mortgage defaults and short sales where the lender agrees to settle for lees than what is owed.

Back to "Grieving"